
Posts Tagged ‘REALTOR’
STAGING YOUR HOUSE TO SELL
Saturday, August 15th, 2015Home staging plays a very important part in successfully selling your house. The impression that the buyer makes of your home is what will determine him to make you an offer for it or keep looking. Here is what a properly staged house should convey to the buyer:
Cleanliness
Your house needs to look spotless. Because we might at times miss something important, it’s recommended to hire a professional cleaning firm at least once before starting to show your house to prospective buyers. While you are at it, it’s a good idea to depersonalize the space – remove family photos and personal items off the shelves, to allow the buyers to feel more comfortable inside your house and not like they are intruding in someone else’s home.
Space
The first thing you need to do in order to create space is to de-clutter. It’s a good idea to just take a look around and remove anything non-essential. Don’t forget kitchen appliances – it’s best to just remove or hide them, same with knives and anything else you might have lying around. Instead, add a vase of flowers or a bowl of fruits.
Your rooms need to look warm and inviting. Furniture can play a significant part here. It’s a good idea to arrange it in such a manner as to maximize the impression of space and at the same time group pieces together to maximize the potential for conversation.
Brightness
Buyers love a house which has enough light. Make sure your windows let as much light through as possible, and change your lamps with stronger ones. You should aim for something in the range of 100w for 50-60 square feet.
Color
It’s a good idea to use neutral colors for areas like the living room and kitchen, because beside being the safer option (different people have different tastes), it also makes a room look more spacious and brighter. For bedrooms however, don’t be afraid to use other colors. Avoid strong, vivid colors like pink – instead go for dark, relaxing colors, which will make the room look more intimate and cozier.
You can further add color to your house by using décor, such as flowers or artwork. Experiment with the way you arrange them, to obtain the best possible effect and draw attention to specific areas of the room.
Every buyer looks for the perfect house. And while it’s true that different people can have very different ideas of what the perfect house should look like, by applying the tips above you will greatly increase the chance that they visualize your house as their future home.
Prices dip as result of higher inventory
Wednesday, August 5th, 2015July 2015 stats from Edmonton real estate board:
AVERAGE-DAYS-ON-MARKET–50-Days
SALES-TO-LISTING-RATIO–53%
HOMES-LISTED-FOR SALE-OVER $1M–190 homes
HOMES-SOLD-YTD-OVER $1M-70 homes
PRICES DIP AS RESULT OF HIGHER INVENTORY
статистика за июль 2015
количество дней на маркете –50-Days
отношение продаж к листингам –53%
количество домов, дороже миллиона на рынке –190 homes
количество ПРОДАННЫХ домов, дороже миллиона с начала года -70 homes
цены понизились из-за большого количества домов на рынке
Edmonton, AUGUST 4, 2015: Prices for all residential properties in the Edmonton for July were down from the previous month
.
The average all residential price was $372,910 (down 1.4% from June) due mostly to the drop in price of single family homes to $436,948 (down 1.8%). The drop was not felt across all categories with condo prices up 0.4% at an average of $256,708 and duplex/rowhouse prices up 1.4% from June at an average of $356,237.
While all residential average prices were down month over month, they still remained 3.3% higher than July of last year.
With reported all residential sales in July down 9.8% from June and down 2.8% from last year, average days on market is up to 50.
This is up from 46 average days on market in July 2014.
Single family dwellings spent an average of 48 days on market in July of 2015, duplex/rowhouses were at 43 days, and condos at 54 days.
“We have seen the biggest drop in condominium sales year to date at 14%. That drop coupled with an increase of condo listings of 17% explains why condos are taking longer on average to sell.
Some of these buyers may be moving over to duplex/townhouse options which is the only residential category showing an increase of sales of 6% year to date.”
There were 73 properties over a million dollars sold by this time last year, the exact same number as this year.
Inventory is still strong at 7,226 for the Edmonton CMA at the end of July 2015, up slightly from 7,177 in June and much higher than the 5,609 available in July of 2014.
All residential listings were up year over year by 14.9% but down month over month from June by 2.2%.
march 2015 market update
Friday, April 3rd, 2015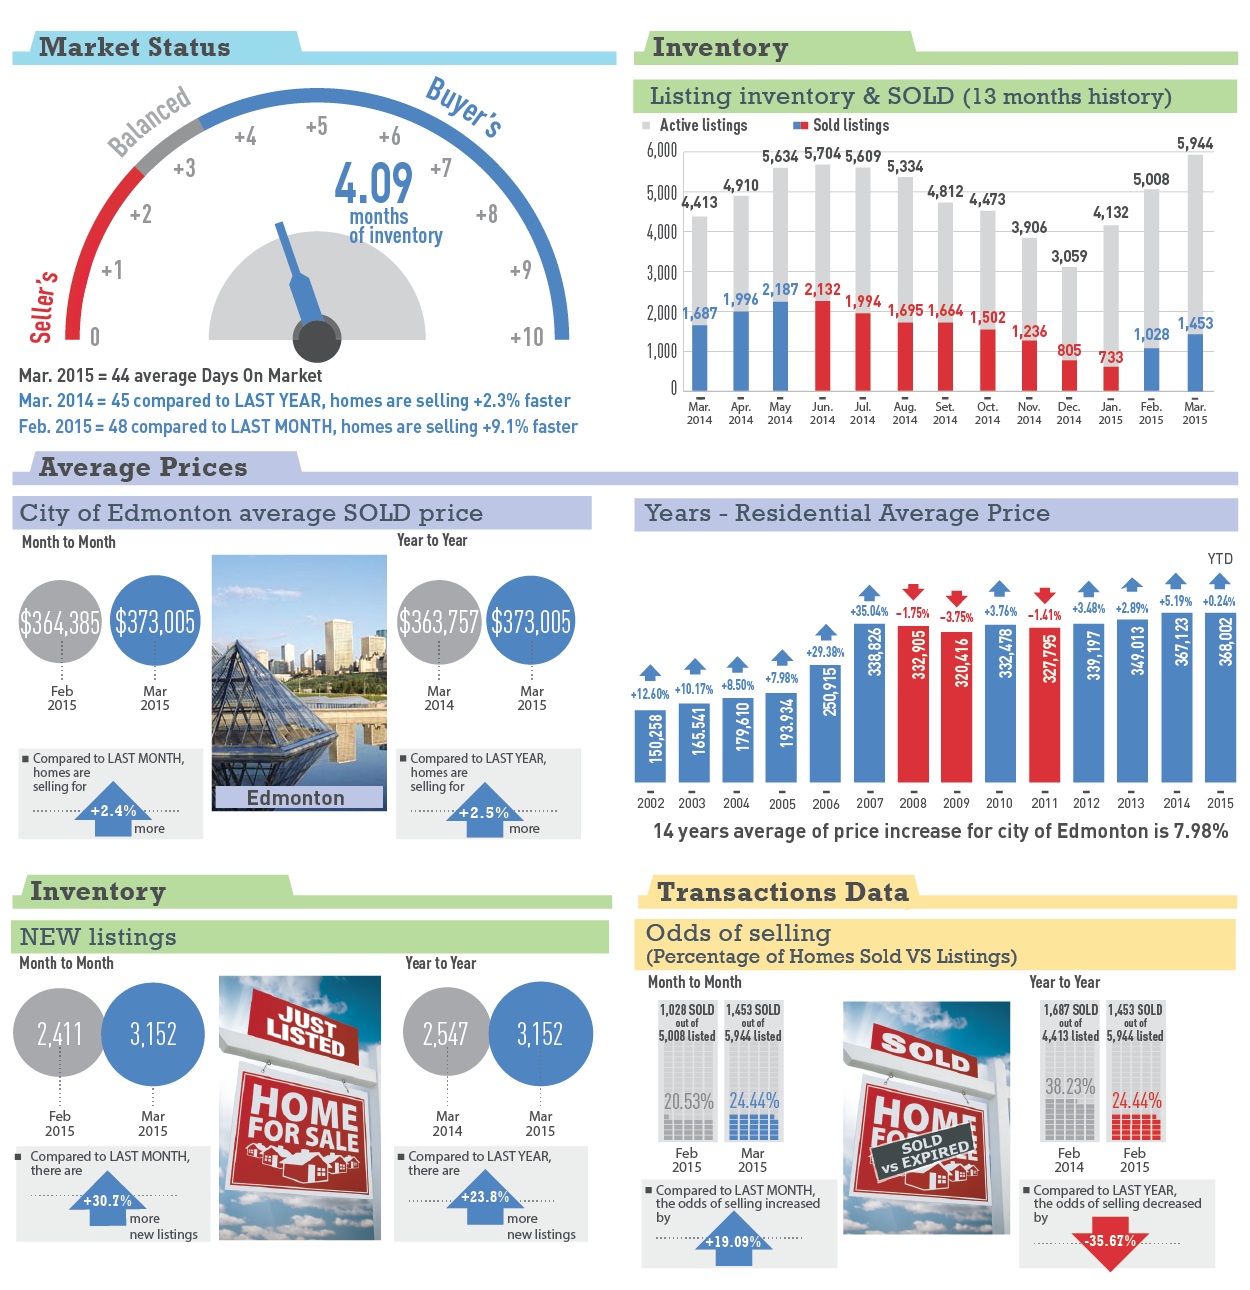
are you interested to see what is happening in the Edmonton market place?
here is stats in beautiful graphics for your review.
email me if you would like to receive these stats on monthly basis.
Market begins seasonal cool off a little later this year
Tuesday, November 4th, 2014The Edmonton area has been blessed with a beautiful fall and the local housing market has followed the weather trend. The fall months always tend to be a quieter market, but this year sales remained strong a little longer than usual. Edmonton Census Metropolitan Area (CMA) total residential average prices remain stable (up 8.5% over last year) thanks in part to an incline in sales of higher priced houses.
The seasonal slide is reflected in the dip in single family sales, down 12% from last month at 850 sold (918 adjusted). While still up almost 8% from last year, single family prices dipped down from $436,870 in September to $426,848 in October, a difference of 2.3%.
With an average price of $260,491, condos actually gained a bit of momentum going up 2.6% month-over-month and 9.75% year-over-year. Duplex/row house prices were also up month-over-month at $352,907.
In October, 2,049 residential properties were listed which is up 18.6% from last year. 1,412 were reported sold (1,525 adjusted) in the Edmonton CMA. Total days on market for all residential properties were down 3 days over October of 2013.
The demand for single family homes in the $350,000 to $400,000 remains high with 185 properties selling in this range in October. However, inventory is tight at the $350,000 to $400,000 mark with only 227 available properties available as of October 31. We have seen a lot of action this year in houses under $400,000. People may need to adjust their expectations when looking at houses in this range. There is a big demand for properties at this price point and with a light inventory, you may need to wait a bit longer to find the right house for you.
Another “hot” market is houses priced over a million dollars. We have seen this trend throughout 2014. Almost 2% of the single family dwellings sold last month were over a million dollars. Compare that to last October where less than one quarter of 1% of the sales were over a million. 125 million dollar plus homes have sold in 2014 compared to 94 at this same time last year and 75 in 2012.
Fall Maintains Summer Heat in Edmonton Market
Thursday, October 2nd, 2014
Reports of the impending burst of the so called “housing bubble” have homeowners looking closer at housing prices this month. While it makes for an exciting story, the numbers just don’t back up the claim. Edmonton Census Metropolitan Area (CMA) continues to see the stable market we have enjoyed over the past few years.
The steady gain year-over-year in housing prices is reflective of a stable and strong market. Average prices, listings, and sales are all up from September of last year. The average days on market for residential properties remained the same as August at 49 (down from 54 days the same time last year). While inventory is still down 6% from September 2013.
The average price for a single family dwelling (SFD) in Edmonton in September stayed strong at $435,584 (down a mere 0.04% from August). Condos were down 3% month over month at an average selling price of $254,494. Duplex/row house prices were up 0.3% to $350,983 and the total residential average price was up 0.8% from August at $372,673.
In September, 2,193 residential properties were listed and 1,568 were reported sold (1,693 adjusted). Single family dwelling reported sales were up 4.7% from last month at 967 (1,044 adjusted) while condos were down 3.6% at 452 (488 adjusted).
We normally see a decrease in sales and average price when fall arrives. The strong market we saw in August continued on into September with surprisingly little to no changes in prices. There is a false idea out there that people only buy houses in the spring and summer. People buy and sell their houses when the time is right for them. Consulting with your Russian Ukrainian speaking local REALTOR – Irina Mierzewski – is the best way to see if the time is right for you.
The number of homes listed for sale in September was 8% higher than the same month last year. The sales-to-listing ratio was 72%: up from 67% last month.
| September 2014 | M/M % Change | Y/Y % Change | |
| SFD2 average3 selling price – month | $435,584 | -0.04% | 6.92% |
| SFD median4 selling price – month | $405,000 | 0.56% | 6.91% |
| Condominium average selling price | $254,494 | -2.94% | 4.85% |
| Condominium median selling price | $232,000 | 1.53% | 2.65% |
| All-residential5 average selling price | $372,673 | 0.83% | 6.37% |
| All-residential median selling price | $350,000 | 0.32% | 4.28% |
| # residential listings this month | 2,193 | -4.74% | 8.08% |
| # residential sales this month (reported) | 1,568 | -7.66% | 9.19% |
| # residential inventory at month end | 4,812 | -9.79% | -5.85% |
| # Total6 MLS® System sales this month | 2,122 | 4.17% | 6.47% |
| $ Total value MLS® System residential sales – month | $668 million | 3.24% | 13.15% |
| $ Total value MLS® System sales – month | $788 million | 4.95% | 13.67% |
| $ Total value MLS® System sales – YTD | $7.6 billion | 12.82% | 16.05% |
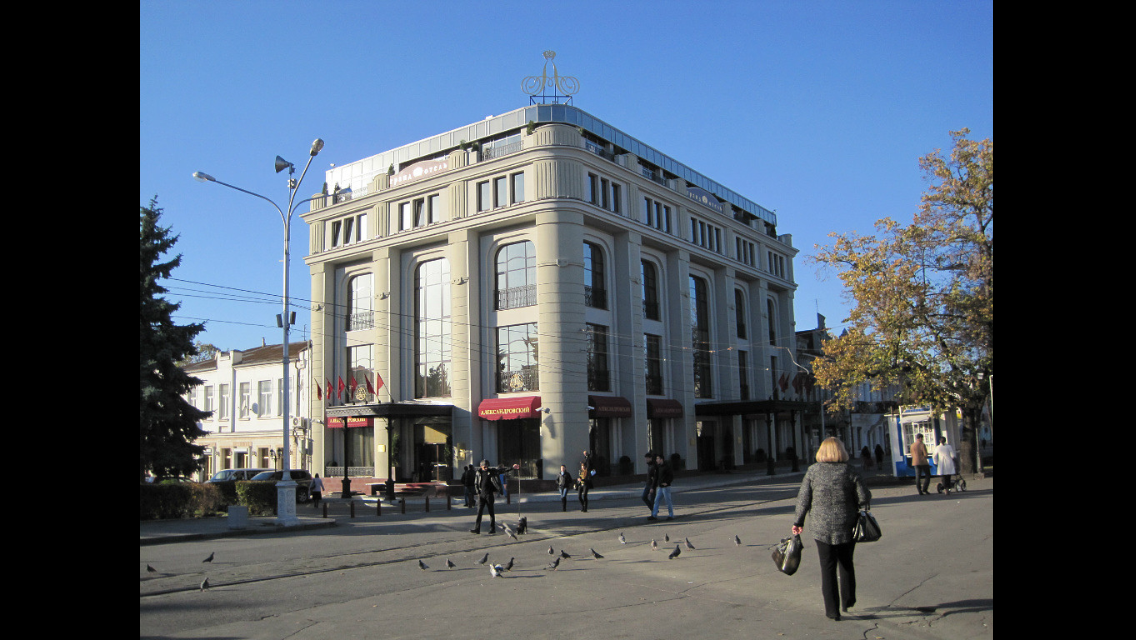
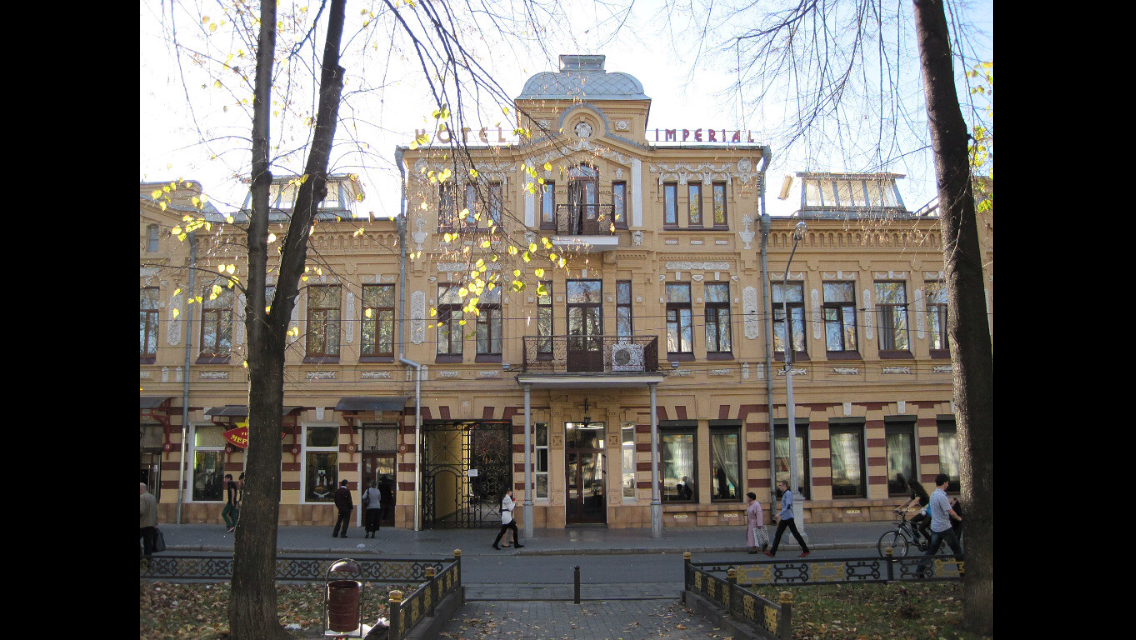
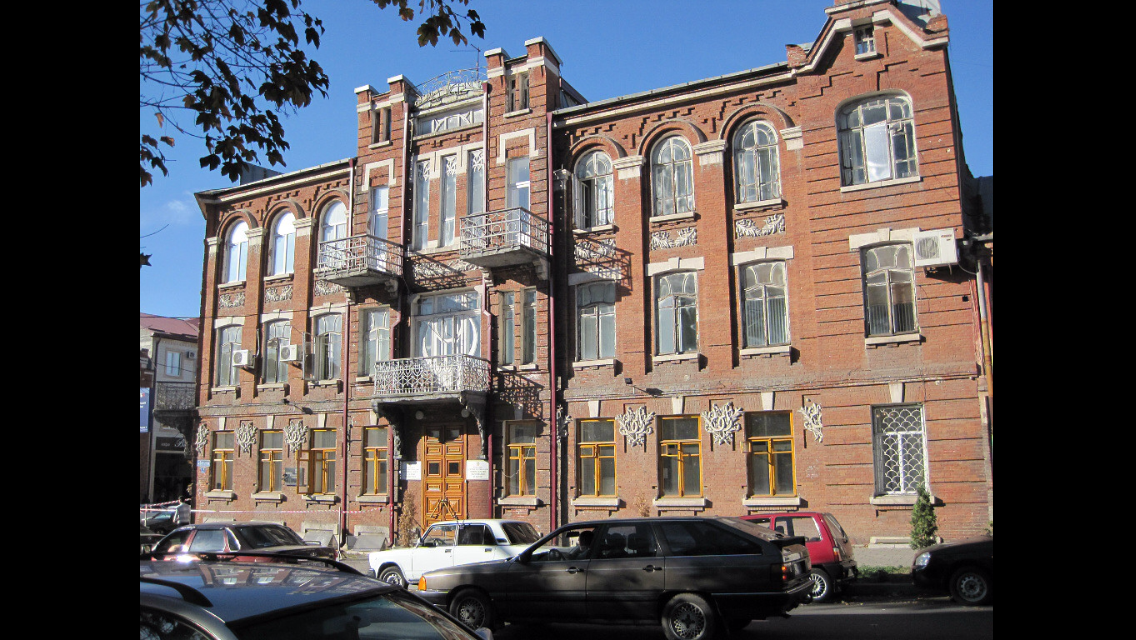
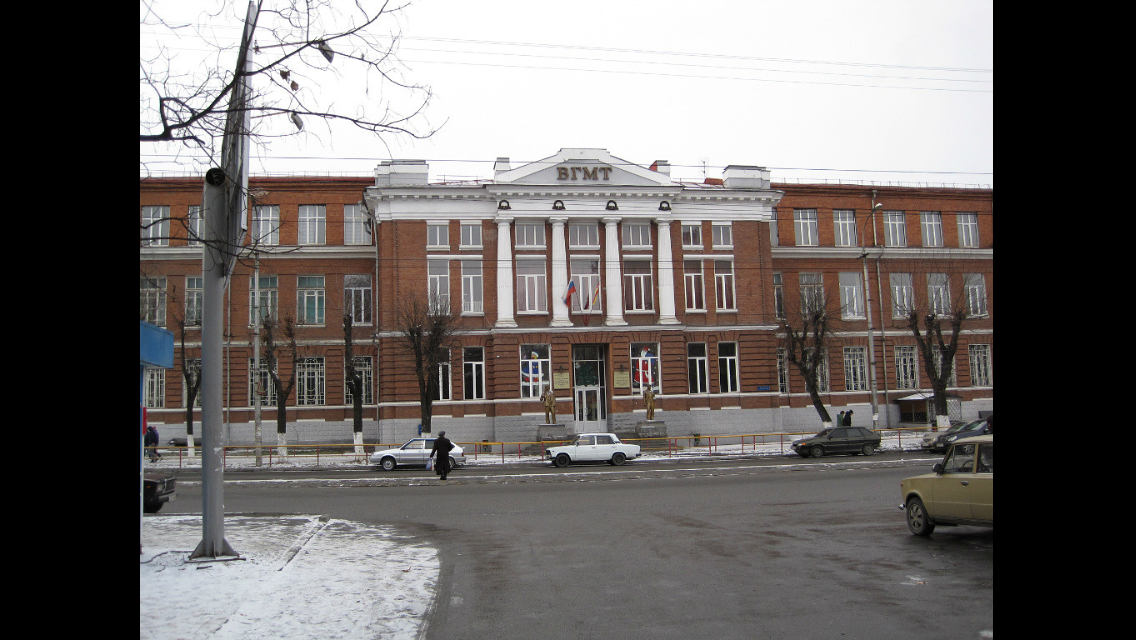
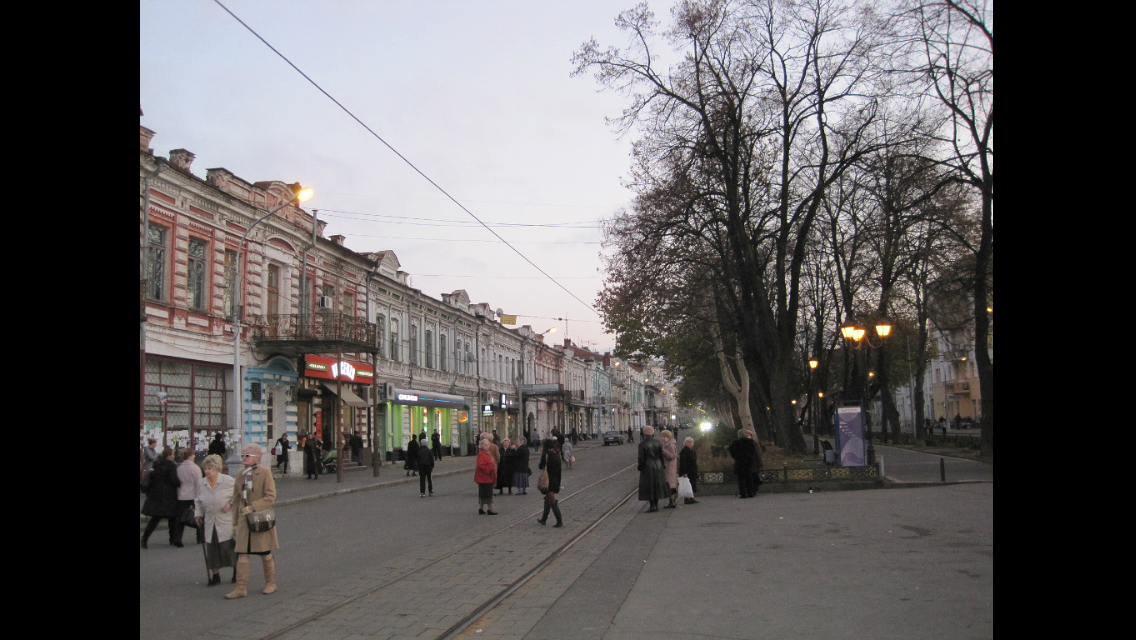
Мой город- ВЛАДИКАВКАЗ! My city – Vladikavkaz!
Monday, September 22nd, 2014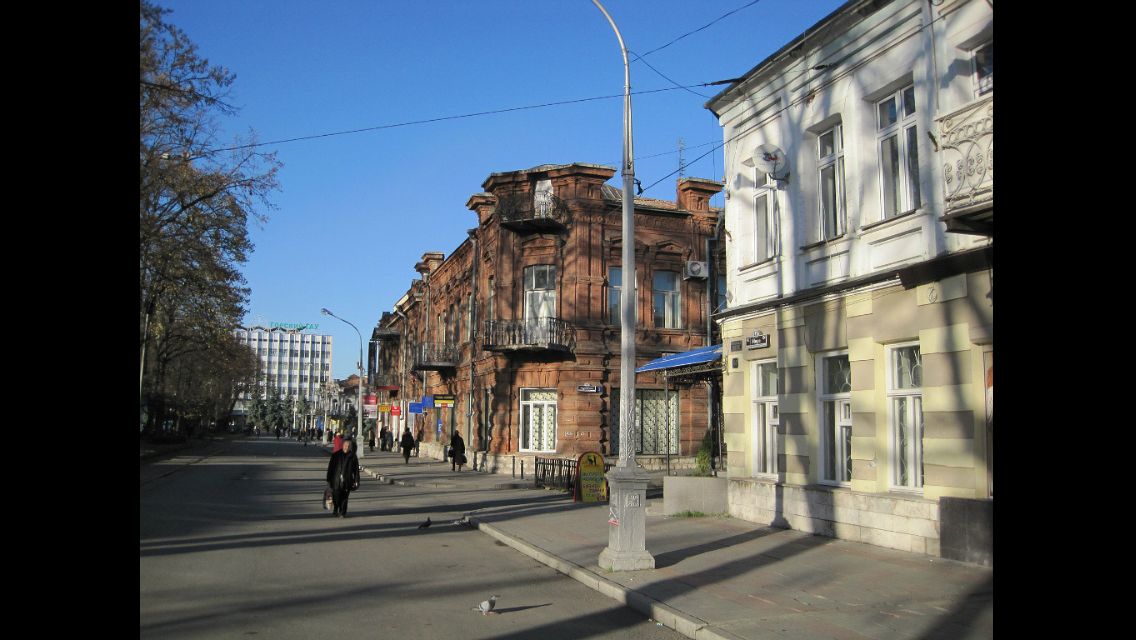
The city was founded in 1784[7] as a fortress during the Russian conquest of the Caucasus and was for many years the main Russian military base in the region.
The Georgian Military Highway, crossing the mountains, was constructed in 1799 to link the city with Georgia to the south, and in 1875 a railway was built to connect it to Rostov-on-Don andBaku in Azerbaijan. Vladikavkaz has become an important industrial center for the region, with smelting, refining, chem icals and manufacturing industries.


From 1931 to 1944 and from 1954 to 1990, its name in both Russian and Ossetic languages was Ordzhonikidze (Орджоники́дзе) (afterSergo Ordzhonikidze, a Georgian Bolshevik), and from 1944 to 1954 it was officially called Dzaudzhikau (Дзауджика́у) in Russian andDzæwdžyqæw (Дзæуджыхъæу) in Ossetic. Vladikavkaz resumed its old Russian name, in 1990, shortly before the dissolution of the Soviet Union; the official Ossetic name was reverted to Dzæwdžyqæw.
Vladikavkaz was fought over in both the Russian Civil War and World War II. In February 1919, the anti-Communist Volunteer Army under General Anton Denikin seized the city, before being expelled by the Red Army in March 1920. In November 1942, the forces of Nazi Germany tried unsuccessfully to seize the city but were repelled.
In 1999, 2008, and 2010, Vladikavkaz was a target of bombings.
Ethnic groups in the city (2002 data):[citation needed]
| Climate data for Vladikavkaz | |||||||||||||
|---|---|---|---|---|---|---|---|---|---|---|---|---|---|
| Month | Jan | Feb | Mar | Apr | May | Jun | Jul | Aug | Sep | Oct | Nov | Dec | Year |
| Record high °C (°F) | 19.6 (67.3) |
23.0 (73.4) |
30.3 (86.5) |
34.0 (93.2) |
35.0 (95) |
38.0 (100.4) |
37.5 (99.5) |
39.2 (102.6) |
38.2 (100.8) |
33.5 (92.3) |
27.0 (80.6) |
27.1 (80.8) |
39.2 (102.6) |
| Average high °C (°F) | 3.0 (37.4) |
3.2 (37.8) |
7.7 (45.9) |
14.8 (58.6) |
19.4 (66.9) |
23.2 (73.8) |
25.7 (78.3) |
25.4 (77.7) |
20.8 (69.4) |
15.1 (59.2) |
8.4 (47.1) |
4.3 (39.7) |
14.3 (57.7) |
| Daily mean °C (°F) | −1.9 (28.6) |
−1.7 (28.9) |
3.0 (37.4) |
9.5 (49.1) |
14.1 (57.4) |
18.0 (64.4) |
20.6 (69.1) |
20.1 (68.2) |
15.6 (60.1) |
9.8 (49.6) |
3.6 (38.5) |
−0.7 (30.7) |
9.2 (48.6) |
| Average low °C (°F) | −5.6 (21.9) |
−5.7 (21.7) |
−0.9 (30.4) |
5.1 (41.2) |
9.6 (49.3) |
13.5 (56.3) |
16.1 (61) |
15.7 (60.3) |
11.2 (52.2) |
5.7 (42.3) |
0.1 (32.2) |
−4.2 (24.4) |
5.1 (41.2) |
| Record low °C (°F) | −27.2 (−17) |
−27.8 (−18) |
−22.0 (−7.6) |
−8.9 (16) |
−2.8 (27) |
2.2 (36) |
7.5 (45.5) |
6.0 (42.8) |
0.0 (32) |
−10.0 (14) |
−22.2 (−8) |
−25.0 (−13) |
−27.8 (−18) |
| Precipitation mm (inches) | 31 (1.22) |
34 (1.34) |
54 (2.13) |
85 (3.35) |
140 (5.51) |
175 (6.89) |
109 (4.29) |
89 (3.5) |
75 (2.95) |
60 (2.36) |
46 (1.81) |
31 (1.22) |
929 (36.57) |
| Avg. precipitation days | 6 | 6 | 8 | 10 | 14 | 14 | |||||||
Housing prices begin seasonal slide, but rise over 2013
Tuesday, August 5th, 2014Edmonton, August 5, 2014:
The Single Family Detached (SFD) average price in July was down 2% from June at $426,716 and the All Residential average price was off 2.6% from June at $362,091 in the Edmonton . Condo prices were stable month-over-month at $254,654 and duplex/rowhouse average prices rallied with a 5% lift to $360,309.
Residential sales were up year-over-year from 1,835 in July 2013 to 2,013 (up 9.7%) with SFD sales (1,179) up compared to the same month last year by 4.8%.
Condo sales of 639 units were up 15.4% and duplex/row house sales were up 27.7% compared to July 2013.
There is adequate supply with over 5,600 residential properties in inventory.
The average days-on-market was up slightly to 46 days in July as compared to 41 days in June. The sales-to-listing ratio was 69%: slower than the 75% last July.
If you are looking to buy or sell your property – call Irina Mierzewski – your english ukrainian russian speaking realtor in edmonton and she will be happy to answer all your questions and assist you in all your real estate needs! please read testimonials on her page and see what other clients are saying about her and her professional real estate expertise .
| M/M % Change | Y/Y % Change | ||
| SFD2 average3 selling price – month | $426,716 | -2.00% | 3.90% |
| SFD median4 selling price – month | $396,000 | -4.00% | 3.10% |
| Condominium average selling price | $254,654 | 0.20% | 4.60% |
| Condominium median selling price | $239,000 | 0.00% | 6.20% |
| All-residential5 average selling price | $362,091 | -2.60% | 3.30% |
| All-residential median selling price | $345,000 | -3.90% | 3.00% |
| # residential listings this month | 2,718 | -8.10% | 10.60% |
| # residential sales this month (reported) | 1,864 | -12.70% | 1.60% |
| # residential inventory at month end | 5,609 | -1.70% | -3.90% |
| # Total6 MLS® System sales this month | 2,570 | -1.95% | 4.10% |
| $ Total value MLS® System residential sales – month | $786 million | -6.10% | 5.70% |
| $ Total value MLS® System sales – month | $948 million | -4.40% | 9.40% |
| $ Total value MLS® System sales – YTD | $5.9 billion | 20.90% | 16.50% |
CMHC to Increase Mortgage Insurance Premiums
Wednesday, March 5th, 2014
OTTAWA, February 28, 2014 — Following the annual review of its insurance products and capital requirements, CMHC will increase its mortgage loan insurance premiums for homeowner and 1 – 4 unit rental properties effective May 1, 2014.
The increase applies to mortgage loan insurance premiums for owner occupied, self-employed and 1-to-4 unit rental properties, including low-ratio refinance premiums. This does not apply to mortgages currently insured by CMHC.
For the average Canadian homebuyer requiring CMHC insured financing, the higher premium will result in an increase of approximately $5 to their monthly mortgage payment. This is not expected to have a material impact on the housing market.
Effective May 1st, CMHC Purchase (owner occupied 1 – 4 unit) mortgage insurance premiums will increase by approximately 15%, on average, for all loan-to-value ranges.
| Loan-to-Value Ratio | Standard Premium (Current) | Standard Premium (Effective May 1st, 2014) |
|---|---|---|
| Up to and including 65% | 0.50% | 0.60% |
| Up to and including 75% | 0.65% | 0.75% |
| Up to and including 80% | 1.00% | 1.25% |
| Up to and including 85% | 1.75% | 1.80% |
| Up to and including 90% | 2.00% | 2.40% |
| Up to and including 95% | 2.75% | 3.15% |
| 90.01% to 95% – Non-Traditional Down Payment | 2.90% | 3.35% |
CMHC reviews its premiums on an annual basis and, going forward, plans to announce decisions on premiums in the first quarter of each year.
| Loan Amount | $150,000 | $250,000 | $350,000 | $450,000 |
| Current Premium | $4,125 | $6,875 | $9,625 | $12,375 |
| New Premium | $4,725 | $7,875 | $11,025 | $14,175 |
| Additional Premium | $600 | $1,000 | $1,400 | $1,800 |
| Increase to Monthly Mortgage Payment | $3.00 | $4.98 | $6.99 | $8.98 |
Based on a 5 year term @ 3.49% and a 25 year amortization
| Loan Amount | $150,000 | $250,000 | $350,000 | $450,000 |
| Current Premium | $2,625 | $4,375 | $6,125 | $7,875 |
| New Premium | $2,700 | $4,500 | $6,300 | $8,100 |
| Additional Premium | $75 | $125 | $175 | $225 |
| Increase to Monthly Mortgage Payment | $0.37 | $0.62 | $0.87 | $1.12 |
Based on a 5 year term @ 3.49% and a 25 year amortization
Local housing sales and inventory up in stable market – Feb 2014
Wednesday, February 5th, 2014
The residential home inventory on the Edmonton Multiple Listing Service® (MLS® System) rose 16% in January. Typically just over 1,800 homes in the Edmonton come onto the market in January. Last month’s listings of 1,842 were higher than the 783 listed in December. Sales figures were higher than a typical January and higher than sales in December and January 2013. The increased inventory kept prices stable in all housing categories.
Compared to December, the all-residential average3 price of $347,847 was down just $1,226 or
-0.16%. Single family detached (SFD) home prices were down 1.5% at $416,344. Condominiums were priced on average3 at $230,463 (down 1.5%) and duplex/rowhouses showed the biggest movement and were down 5.3% at $336,220.
Price stability and more property available for sale results in a balanced market.Right now both buyers and sellers have time to consider all their options and housing needs. More homes are listed every day and Irina Mierzewski your russian speaking REALTOR® can advise you of a suitable property as soon as it comes available.
The residential sales-to-listing ratio was 45% and the average days-on-market was 61 days in January compared to 73 days in January 2013. There have been four property sales over a $1 million already this year but half of the SFDs sold in January were sold at or below $385,000.
Strong economic indicators such as low unemployment, higher hourly wages and positive in-migration all support an optimistic view of the Edmonton and area housing market. Consumers are confident in their economic future and prepared to risk a first-time or move-up purchase. Low rental vacancies and the potential for higher rental rates are also attracting investors into the market.
Irina Mierzewski – your russian/ukranian speaking REALTOR in Edmonton will be happy to answer all your questions and give her professional advise whether you sell or buy property in the near future.
| January 2014 | M/M % Change | Y/Y % Change | |
| SFD2 average3 selling price – month | $416,344 | -1.50% | 4.60% |
| SFD median4 selling price – month | $385,000 | 0.20% | 2.70% |
| Condominium average selling price | $230,463 | -1.50% | 6.70% |
| Condominium median selling price | $216,500 | -1.10% | 3.80% |
| All-residential5 average selling price | $347,847 | -0.20% | 6.70% |
| All-residential median selling price | $329,500 | 0.45% | 4.60% |
| # residential listings this month | 1,842 | 135.20% | 4.20% |
| # residential sales this month (reported) | 820 | 10.00% | -1.00% |
| # residential inventory at month end | 3,537 | 16.00% | -5.50% |
| # Total6 MLS® System sales this month | 1,095 | 14.70% | -11.90% |
| $ Total value MLS® System residential sales – month | $328 million | 12.90% | -6.50% |
| $ Total value MLS® System sales – month | $392 million | 11.20% | -3.80% |
| $ Total value MLS® System sales – YTD | $392 million | 11.20% | -3.80% |
