Posts Tagged ‘comfree’
Saturday, August 15th, 2015
Home staging plays a very important part in successfully selling your house. The impression that the buyer makes of your home is what will determine him to make you an offer for it or keep looking. Here is what a properly staged house should convey to the buyer:
Cleanliness
Your house needs to look spotless. Because we might at times miss something important, it’s recommended to hire a professional cleaning firm at least once before starting to show your house to prospective buyers. While you are at it, it’s a good idea to depersonalize the space – remove family photos and personal items off the shelves, to allow the buyers to feel more comfortable inside your house and not like they are intruding in someone else’s home.
Space
The first thing you need to do in order to create space is to de-clutter. It’s a good idea to just take a look around and remove anything non-essential. Don’t forget kitchen appliances – it’s best to just remove or hide them, same with knives and anything else you might have lying around. Instead, add a vase of flowers or a bowl of fruits.
Your rooms need to look warm and inviting. Furniture can play a significant part here. It’s a good idea to arrange it in such a manner as to maximize the impression of space and at the same time group pieces together to maximize the potential for conversation.
Brightness
Buyers love a house which has enough light. Make sure your windows let as much light through as possible, and change your lamps with stronger ones. You should aim for something in the range of 100w for 50-60 square feet.
Color
It’s a good idea to use neutral colors for areas like the living room and kitchen, because beside being the safer option (different people have different tastes), it also makes a room look more spacious and brighter. For bedrooms however, don’t be afraid to use other colors. Avoid strong, vivid colors like pink – instead go for dark, relaxing colors, which will make the room look more intimate and cozier.
You can further add color to your house by using décor, such as flowers or artwork. Experiment with the way you arrange them, to obtain the best possible effect and draw attention to specific areas of the room.
Every buyer looks for the perfect house. And while it’s true that different people can have very different ideas of what the perfect house should look like, by applying the tips above you will greatly increase the chance that they visualize your house as their future home.
Tags: alberta, appartments, comfree, condo, duplexes, edmonton, homes in edmonton, house for sale, market, property, real estate, REALTOR, купить, продать, риалтор, риэлтор, русский, русский риалтор, русский эдмонтон, эдмонтон
Posted in For Sale By Owner FSBO, selling your home | Comments Off on STAGING YOUR HOUSE TO SELL
Monday, September 22nd, 2014
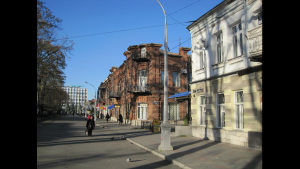

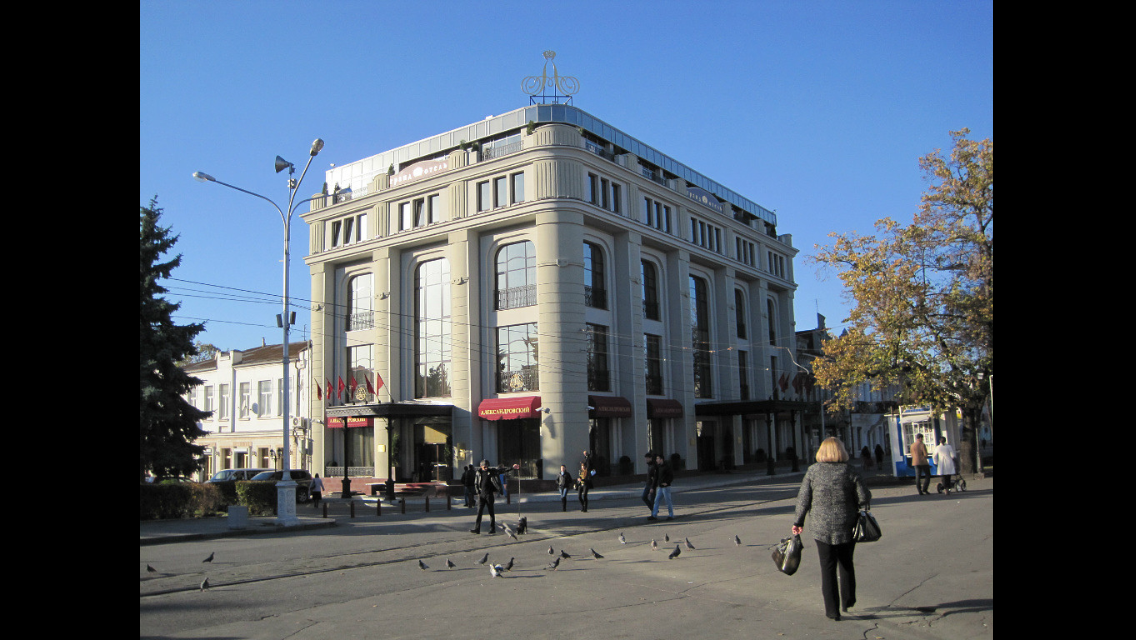
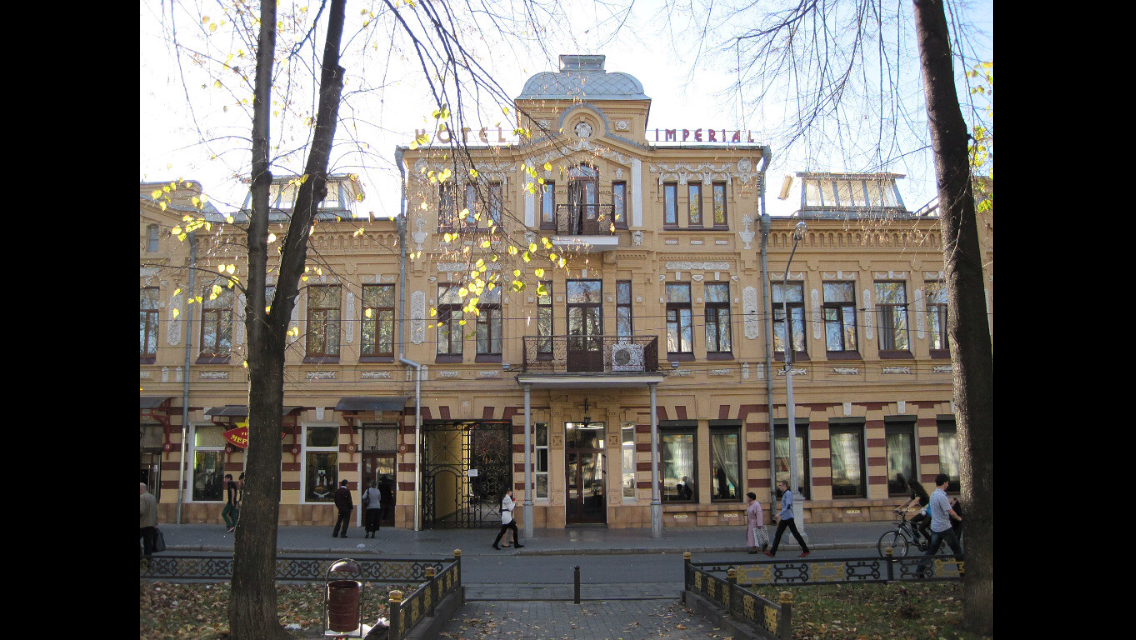
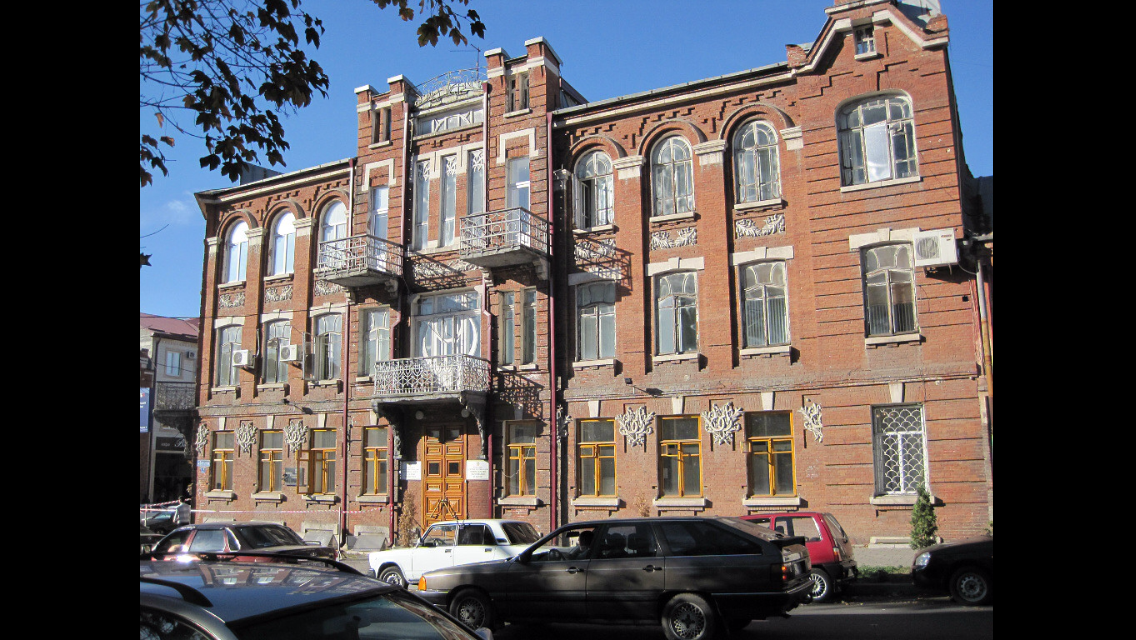
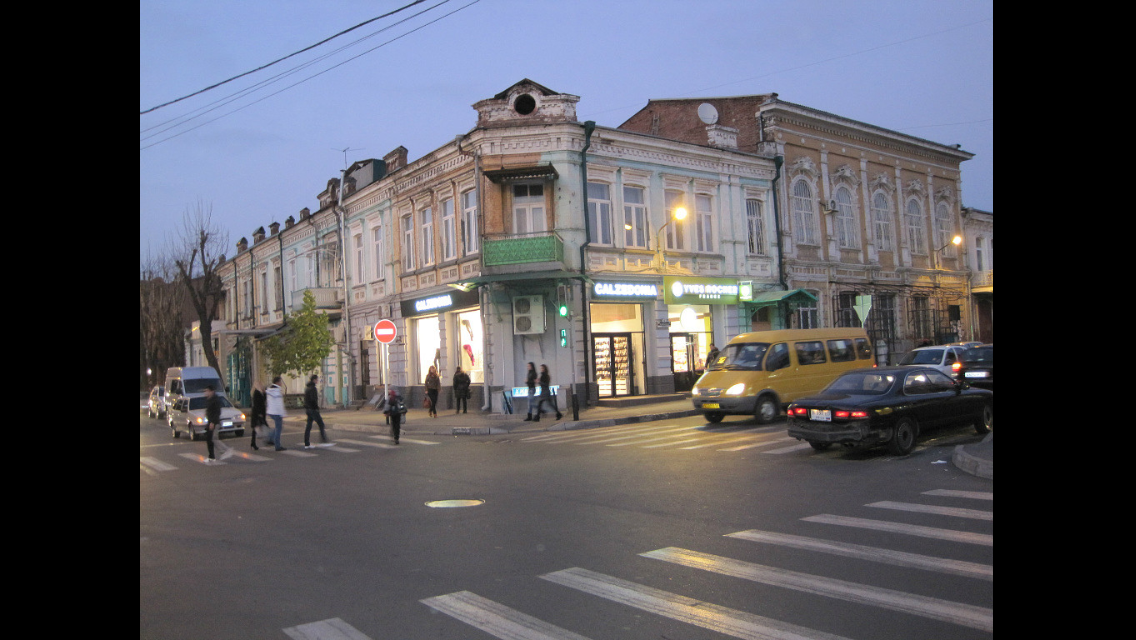
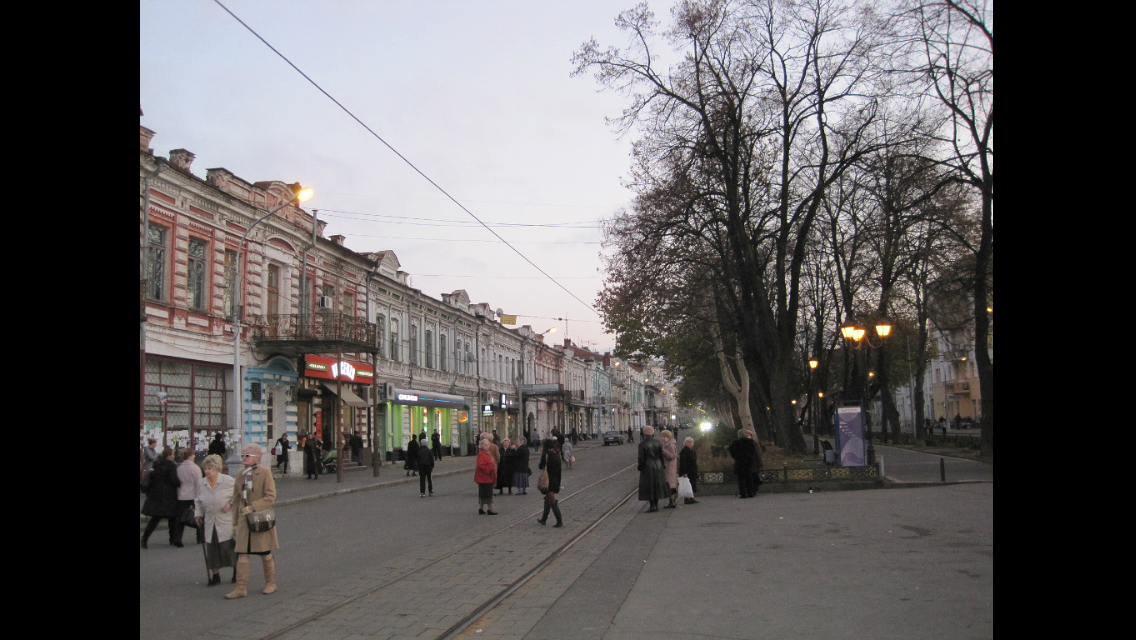
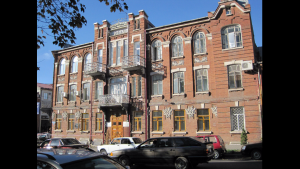
The city was founded in 1784[7] as a fortress during the Russian conquest of the Caucasus and was for many years the main Russian military base in the region.
The Georgian Military Highway, crossing the mountains, was constructed in 1799 to link the city with Georgia to the south, and in 1875 a railway was built to connect it to Rostov-on-Don andBaku in Azerbaijan. Vladikavkaz has become an important industrial center for the region, with smelting, refining, chem icals and manufacturing industries.


From 1931 to 1944 and from 1954 to 1990, its name in both Russian and Ossetic languages was Ordzhonikidze (Орджоники́дзе) (afterSergo Ordzhonikidze, a Georgian Bolshevik), and from 1944 to 1954 it was officially called Dzaudzhikau (Дзауджика́у) in Russian andDzæwdžyqæw (Дзæуджыхъæу) in Ossetic. Vladikavkaz resumed its old Russian name, in 1990, shortly before the dissolution of the Soviet Union; the official Ossetic name was reverted to Dzæwdžyqæw.
Vladikavkaz was fought over in both the Russian Civil War and World War II. In February 1919, the anti-Communist Volunteer Army under General Anton Denikin seized the city, before being expelled by the Red Army in March 1920. In November 1942, the forces of Nazi Germany tried unsuccessfully to seize the city but were repelled.
In 1999, 2008, and 2010, Vladikavkaz was a target of bombings.
Ethnic groups in the city (2002 data):[citation needed]
| Climate data for Vladikavkaz |
| Month |
Jan |
Feb |
Mar |
Apr |
May |
Jun |
Jul |
Aug |
Sep |
Oct |
Nov |
Dec |
Year |
| Record high °C (°F) |
19.6
(67.3) |
23.0
(73.4) |
30.3
(86.5) |
34.0
(93.2) |
35.0
(95) |
38.0
(100.4) |
37.5
(99.5) |
39.2
(102.6) |
38.2
(100.8) |
33.5
(92.3) |
27.0
(80.6) |
27.1
(80.8) |
39.2
(102.6) |
| Average high °C (°F) |
3.0
(37.4) |
3.2
(37.8) |
7.7
(45.9) |
14.8
(58.6) |
19.4
(66.9) |
23.2
(73.8) |
25.7
(78.3) |
25.4
(77.7) |
20.8
(69.4) |
15.1
(59.2) |
8.4
(47.1) |
4.3
(39.7) |
14.3
(57.7) |
| Daily mean °C (°F) |
−1.9
(28.6) |
−1.7
(28.9) |
3.0
(37.4) |
9.5
(49.1) |
14.1
(57.4) |
18.0
(64.4) |
20.6
(69.1) |
20.1
(68.2) |
15.6
(60.1) |
9.8
(49.6) |
3.6
(38.5) |
−0.7
(30.7) |
9.2
(48.6) |
| Average low °C (°F) |
−5.6
(21.9) |
−5.7
(21.7) |
−0.9
(30.4) |
5.1
(41.2) |
9.6
(49.3) |
13.5
(56.3) |
16.1
(61) |
15.7
(60.3) |
11.2
(52.2) |
5.7
(42.3) |
0.1
(32.2) |
−4.2
(24.4) |
5.1
(41.2) |
| Record low °C (°F) |
−27.2
(−17) |
−27.8
(−18) |
−22.0
(−7.6) |
−8.9
(16) |
−2.8
(27) |
2.2
(36) |
7.5
(45.5) |
6.0
(42.8) |
0.0
(32) |
−10.0
(14) |
−22.2
(−8) |
−25.0
(−13) |
−27.8
(−18) |
| Precipitation mm (inches) |
31
(1.22) |
34
(1.34) |
54
(2.13) |
85
(3.35) |
140
(5.51) |
175
(6.89) |
109
(4.29) |
89
(3.5) |
75
(2.95) |
60
(2.36) |
46
(1.81) |
31
(1.22) |
929
(36.57) |
| Avg. precipitation days |
6 |
6 |
8 |
10 |
14 |
14 |
Tags: alberta, buy, buy house, buying, comfree, condo, edmonton, house, house for rent, house for sale, investment, property, real estate, REALTOR, sell condo edmonton, sell house, Vladikavkaz, канада, купить, продать, риэлтор, русский риэлтор, русский эдмонтон, эдмонтон
Posted in Some info about Russia | Comments Off on Мой город- ВЛАДИКАВКАЗ! My city – Vladikavkaz!
Wednesday, February 5th, 2014
The residential home inventory on the Edmonton Multiple Listing Service® (MLS® System) rose 16% in January. Typically just over 1,800 homes in the Edmonton come onto the market in January. Last month’s listings of 1,842 were higher than the 783 listed in December. Sales figures were higher than a typical January and higher than sales in December and January 2013. The increased inventory kept prices stable in all housing categories.
Compared to December, the all-residential average3 price of $347,847 was down just $1,226 or
-0.16%. Single family detached (SFD) home prices were down 1.5% at $416,344. Condominiums were priced on average3 at $230,463 (down 1.5%) and duplex/rowhouses showed the biggest movement and were down 5.3% at $336,220.
Price stability and more property available for sale results in a balanced market.Right now both buyers and sellers have time to consider all their options and housing needs. More homes are listed every day and Irina Mierzewski your russian speaking REALTOR® can advise you of a suitable property as soon as it comes available.
The residential sales-to-listing ratio was 45% and the average days-on-market was 61 days in January compared to 73 days in January 2013. There have been four property sales over a $1 million already this year but half of the SFDs sold in January were sold at or below $385,000.
Strong economic indicators such as low unemployment, higher hourly wages and positive in-migration all support an optimistic view of the Edmonton and area housing market. Consumers are confident in their economic future and prepared to risk a first-time or move-up purchase. Low rental vacancies and the potential for higher rental rates are also attracting investors into the market.
Irina Mierzewski – your russian/ukranian speaking REALTOR in Edmonton will be happy to answer all your questions and give her professional advise whether you sell or buy property in the near future.
| January 2014 |
|
M/M % Change |
Y/Y % Change |
| SFD2 average3 selling price – month |
$416,344 |
-1.50% |
4.60% |
| SFD median4 selling price – month |
$385,000 |
0.20% |
2.70% |
| Condominium average selling price |
$230,463 |
-1.50% |
6.70% |
| Condominium median selling price |
$216,500 |
-1.10% |
3.80% |
| All-residential5 average selling price |
$347,847 |
-0.20% |
6.70% |
| All-residential median selling price |
$329,500 |
0.45% |
4.60% |
| # residential listings this month |
1,842 |
135.20% |
4.20% |
| # residential sales this month (reported) |
820 |
10.00% |
-1.00% |
| # residential inventory at month end |
3,537 |
16.00% |
-5.50% |
| # Total6 MLS® System sales this month |
1,095 |
14.70% |
-11.90% |
| $ Total value MLS® System residential sales – month |
$328 million |
12.90% |
-6.50% |
| $ Total value MLS® System sales – month |
$392 million |
11.20% |
-3.80% |
| $ Total value MLS® System sales – YTD |
$392 million |
11.20% |
-3.80% |
Tags: alberta, appartment, appartments, associattion, buy, buyer, buying, canada, canadian, comfree, condo, condos, countertops, duplexes, edmonton, for sale, home, homes in edmonton, house, houses for sale, housing, investment, listings, market, MLS townhouse, properties, property, province, real estate, REALTOR, sales, selling, stats, канада, купить, недвижимость, продать, риэлтор, русский, эдмонтон
Posted in market update | Comments Off on Local housing sales and inventory up in stable market – Feb 2014
Saturday, October 5th, 2013
The all-residential average price for the first three quarters of the year in the Edmonton CMA is $350,741 as compared to $340,090 in 2012. In September, the all-residential average was $352,057, up 5.4% from a year ago and inching up from $351,455 in the previous month.
Year-over-year sales were also up 19.4% with 1,466 (adjusted, 1,357 actual) all-residential sales in September. There were 13,691 residential sales in the Edmonton CMA in the first three quarters of 2013 as compared to just 12,876 sales at the same time last year.
The market is very active with many properties attracting multiple offers.The increases in the Alberta population are driving the market and because of the steady sales there are inventory shortages at the lower price ranges.
There were 926 (adjusted, actual 857) single-family detached sales in September at an average price of $408,642 (up 3.9% Y/Y) as compared to 773 sales a year ago at an average price of $393,374. Condos sold on average in September for $243,655 (438 adjusted sales, 406 actual), up from $224,330 last September (up 8.6%). Duplex/row house sales were up with 79 (adjusted ,73 actual) sales, valued on average at $338,250 ($316,973 last year).
Average sales prices are the highest they have been in five years,Combined with the highest sales numbers since 2012, we have year-to-date residential sales values totaling $4.8 million. Strong market fundamentals, increasing population and the persistence of low mortgage rates have convinced many buyers that an investment in real estate is secure.
The September sales-to-listing ratio of 65% was the result of 2,089 residential listings and 1,357 residential sales. The inventory of available homes on the Edmonton MLS® System was down from 5,557 units in August to 5,111 units in September. It took 54 days on average (up one) to sell a home in the Edmonton area. Irina Mierzewski has access to all the latest market data and effective marketing tools and is the best source of real estate advice for both buyers and sellers.
MLS® System Activity (for all-residential sales in Edmonton CMA1)
| September 2013 |
|
M/M % Change |
Y/Y % Change |
| SFD2 average3 selling price – month |
$408,642 |
-1.90% |
3.90% |
| SFD median4 selling price – month |
$380,000 |
0.00% |
3.50% |
| Condominium average selling price |
$243,655 |
-0.40% |
8.60% |
| Condominium median selling price |
$226,000 |
-1.70% |
3.80% |
| All-residential5 average selling price |
$352,057 |
0.20% |
5.40% |
| All-residential median selling price |
$336,000 |
1.80% |
5.30% |
| # residential listings this month |
2,089 |
-9.10% |
1.70% |
| # residential sales this month (actual) |
1,357 |
-8.90% |
10.50% |
| # residential inventory at month end |
5,111 |
-8.00% |
-9.80% |
| # Total6 MLS® System sales this month |
1,882 |
-5.60% |
9.42% |
| $ Value Total residential sales this month |
$562 million |
-6.50% |
14.83% |
| $ Value of total MLS® System sales – month |
$657 million |
-7.80% |
14.30% |
| $ Value of total MLS® System sales – YTD |
$6.463 billion |
11.90% |
7.71% |
1 Census Metropolitan Area (Edmonton and municipalities in the four surrounding counties)
2 Single Family Dwelling
3 Average: The total value of sales in a category divided by the number of properties sold
4 Median: The middle figure in an ordered list of all sales prices
5 Residential includes SFD, condos and duplex/row houses
6 Includes residential, rural and commercial sales
3 Average prices indicate market trends only. They do not reflect actual changes for a particular property, which may vary from house to house and area to area. Prior period sales figures have been adjusted to include late reported sales and cancellations and therefore reflect a more accurate view of the period than previously reported at month end. The RAE trading area includes communities beyond the CMA (Census Metropolitan Area) and therefore average and median prices may include sold properties outside the CMA. For information on a specific area, contact Irina Mierzewski – your local REALTOR®
Tags: alberta, appartments, area, beaumont, buy, canada, comfree, condo, duplexes, edmonton, for sale, homes, homes in edmonton, houses for sale in edmonton, investment, leduc, macewan, MLS townhouse, owners, properties, property, purchase, real estate, rent, rutherford, sales, sell, selling, to, канада, риэлтор, эдмонтон
Posted in market update | Comments Off on September Housing prices up 5.4% from last year!
Wednesday, April 3rd, 2013
The REALTORS® Association of Edmonton reports that residential property prices in the Edmonton CMA1 were up again in March. The all-residential price (includes single family detached, condominiums, duplexes and row-houses) rose 3.5% in a month and single family detached prices were up 3.9%. Compared to March 2012, the all residential price was up 4.3% and the SFD price was up 7.0%.
Because of a shortage of lower priced homes, the average price is pushed up as buyers move up-market to find a home. The increase in average price may not increase the market value of a particular property. The relative number of homes sold in the $450-650k price range increased from 12.2% to 14.5% year-over-year while homes under $300,000 dropped from 40.7% of the market to 38.2%.
The average price for a single family detached home was $416,739 in March, condos were priced at $246,574 (up 6.3% m/m), duplex and rowhouses at $316,110 (down 4.9% m/m) and the all-residential average price was $354,759. SFD prices peaked in May of 2007 at $424,400.
The demand for homes in the Edmonton area continues to be driven by net job creation and low unemployment, economic stability and low rental vacancy rates. Sales were brisk with the sales-to-listing ratio up at 57% for March which indicates that almost six of the ten homes listed during the month were sold. Days-on-market was down from 57 in February to 50 in March.
The number of homes available for sale in the MLS® System inventory was up from 4,183 to 4,741 in March. While this is an increase of 558 properties from last month, it is down 15.4% from the same time last year. The lower inventory is exerting upward pressure on prices but has a dampening effect on sales. “When first time buyers cannot find a house that meets their needs or are forced into a multiple offer situation, they often remain on the sidelines. Low interest rates and rising rental rates create the interest and desire but lack of suitable properties means they are not able to make the transition to home ownership at this time.
REALTORS® are facing some multiple offer situations on lower-priced property but overall, the market remains in balance with neither buyers nor sellers having an advantage in most neighbourhoods.
Residential sales in the Edmonton CMA were up 1.14% in March as compared to March 2012. There were 1,497 estimated sales (1,386 reported) on listings of 2,422 during the month. SFD sales were down 6.63% from last year but condo sales more than compensated at 8.84% y/y increase. Note that sales numbers are estimated to reflect late reported sales and make a more accurate comparison with prior month actual sales.
MLS® System Activity (for all-residential sales in Edmonton CMA1)
| March 2013 |
|
M/M % Change |
Y/Y % Change |
| SFD2 average3 selling price – month |
416,739 |
3.93% |
7.03% |
| SFD median4 selling price – month |
380,000 |
1.20% |
4.40% |
| Condominium average selling price |
246,574 |
6.34% |
7.53% |
| Condominium median selling price |
229,500 |
8.03% |
4.32% |
| All-residential5 average selling price |
354,759 |
3.51% |
4.30% |
| All-residential median selling price |
329,700 |
0.84% |
2.00% |
| # residential listings this month |
2,422 |
21.40% |
-14.93% |
| # residential sales this month |
1,386 |
37.50% |
-6.35% |
| # residential inventory at month end |
4,741 |
13.34% |
-15.41% |
| # Total6 MLS® System sales this month |
1,822 |
33.58% |
-8.30% |
| $ Value Total residential sales this month |
$569 million |
40.02% |
-2.54% |
| $ Value of total MLS® System sales – month |
$644 million |
36.88% |
-5.17% |
| $ Value of total MLS® System sales – YTD |
$1.458 billion |
39.82% |
-4.81% |
Tags: alberta, appartment, associattion, buy, buying, canada, comfree, condo, duplexes, edmonton, home, homes in edmonton, house, investment, market, MLS townhouse, property, real estate, sales, аренда, бизнес, дом, жилье, канада, квартира, культура, купить, маклер, общество, община, помещение, провинция, продажа, продать, риэлтор, русская, русские, русско-говорящий риэлтор, рынок, снять, статистика, цены, эдмонтон
Posted in market update, selling your home | Comments Off on Housing prices and sales up in active, but balanced market
Tuesday, March 19th, 2013
Canada is one of the best countries in the world for home ownership. We are now clearly the fastest growing nation in the G8 regarding immigration as recently reported in the Globe and Mail. Canada is setting its sights on an annual immigration of 400,000 people by 2016 up from the current 320,000.
The demand for home ownership across all provinces will be significant for decades. As Canadians we can feel confident that our home will continue to be a place where we raise our families, have our dreams come true and remain a cornerstone of our life long financial wellbeing, despite what the media would like us to believe.
The U.S. economy is showing signs of consistent growth with housing starts and new jobs leading the charge. This of course bodes well for us and is particularly welcome news for our manufacturing and resource sectors.
So the economy on both sides of the border looks promising, immigration will continue to add to the growth of Canada and interest rates are historically low. Regardless of what some might want us to think Canada is Still the Best Place to Own a Home!
If you know anyone who is looking to buy a home, it’s important that they get pre-approved today! The spring market is fast approaching and there is evidence everywhere of a pent up demand. Having that pre-approved mortgage in hand can give someone the advantage over other buyers.
Call or email me today!
Tags: alberta, appartment, appartments, associattion, buy, buying, canada, canadian, comfree, condo, countertops, duplexes, edmonton, homes, homes in edmonton, house, how to, immigration, investment, kitchen, landlord, market, MLS townhouse, owners, prices, properties, property, province, real estate, REALTOR, rental, resale, sell, stats
Posted in buying your home | Comments Off on Canada is Still the Best Place to Own a Home!
Tuesday, November 13th, 2012
Tags: alberta, appartments, canadian, comfree, condos, edmonton, houses, how to, investment, landlord, market, MLS townhouse, property, province, real estate, REALTOR, rent, rental, sales, selling, stats
Posted in market update | Comments Off on Calgary top real estate investment market in Canada, Edmonton ranked second
Friday, November 2nd, 2012
Edmonton, November 2, 2012: Even with ghosts, ghouls, and goblins running through the streets, homeowners could find refuge in the local housing market. The REALTORS® Association of Edmonton reports that housing prices in October were up compared to a year ago and are the highest in October in the past five years. The all residential average price for the Edmonton Multiple Listing Service® was up 0.6% at $324,924 when compared to October 2011. The average price of a single family detached home was $372,061 up 2.1% over a year ago. Condos were priced on average at $234,177 which was an uptick of 1.8% from a month ago and up 5.4% from last October. Duplex/row house prices were down 1.1% Y/Y at $305,777.
Homesellers are pleased that their property may be worth more than it has been in the past five years but homebuyers can plan their financing in an environment of small, steady price increases. The housing market is be-deviled in other centres but here in Edmonton both buyers and sellers find it heavenly. The pace of sales is steady, prices increase year-over-year, there is sufficient inventory and average days-on-market is reasonable.
REALTORS® listed an average of 72 homes each day in October and sold an average of 44 per day. There were a total of 2,228 residential listings in October, with sales of 1,375 properties. As a result of lower listings and larger sales volumes, the month end residential inventory was down (-7.9%) from last month with 6,406 properties available. Days-on-market was an average of 61 and the sales to listing ratio was 62%. There was $447 million worth of residential property, $53 million of rural and $23 million of commercial property sold through the Edmonton MLS® in October.
Life happens to us all, unless you are an investor, the best time to buy or sell your home is when your lifestyle changes. No matter what your personal circumstances, Irina Mierzewski – your REALTOR® is here when life happens.
Tags: 3 bedrooms, alberta, appartment, associattion, buyer, canadian, cheap, comfree, condo, countertops, duplexes, edmonton, ereb, for sale, house, housing, investment, kitchen, landlord, MLS townhouse, owners, prices, property, province, real estate, rent, rental, sales, seller, single family house, stats, to buy, unit
Posted in market update | Comments Off on Nothing Scary in Halloween Housing Market
Wednesday, October 3rd, 2012
Edmonton, October 2, 2012: The REALTORS® Association of Edmonton reports that residential listings and sales have trended lower in the third quarter after an active start to the year. In September, there were 1,269 residential sales in the greater Edmonton market as compared to 1,442 in September 2011. Despite the recent cooling trend, residential sales year-to-date are still up 7.2% as compared to last year at this time. There have been 14,565 residential sales to the end of the third quarter as compared to just 13,729 last year.
“There were changes to the mortgage qualification rules in March,” said REALTORS® Association of Edmonton President Doug Singleton. “We did not see an effect on the local market at that time but it seems to have had a cooling effect in the past quarter.”
The average1 price for a single family dwelling (SFD) has remained higher than last year for each of the past nine months. In September, the SFD average price of $376,678 was up just 0.23% from the previous year and is up 2.78% from the January 1 price. The all-residential average price is down 2.6% from last year at $323,369. This is the first month this year that the all-res price has dipped below the 2011 figure for the same month.
Condominium and duplex/rowhouse prices are more volatile and vary widely from month to month. In September average condo prices were down 3.1% ($229,246) while duplex/townhouse prices on average were up 2.75% ($307,739). Still, after nine months both current prices are up from the January 1, 2012 prices for the category.
Total MLS® System listings this year are up 104 units as compared to last year at 33,295 properties but Total MLS® System year-to-date sales are 16,487 units as compared to 15,378 at the end of the third quarter in 2011. There are 6,956 residential properties in the inventory compared to the 8,062 last year at this time. Rural and commercial property sales are both up marginally compared to last year although listings have dropped. The residential sales-to-listing ratio was down from 56.7% to 52.3% and residential days-on-market was up to 59 in September from 54 in August.
“Sales always fall month-to-month at the end of the year; that’s just normal market fluctuation,” said Singleton. “But overall, the market has been stable with little market advantage for either buyers or sellers. Edmonton is still one of the best places in North America to own property and I urge consumers to talk to their local REALTOR® when they are in a position to buy or sell property.”
Tags: alberta, appartment, buy, comfree, condo, duplex, edmonton, how to, investment, market, property, real estate, sale by owner, sales
Posted in market update | Comments Off on Residential Housing Market cools in third quarter
Thursday, September 6th, 2012
Edmonton, September 5, 2012: Residential property sales in August slowed both month-to-month and year-to-year, mirroring a trend that has evolved nationally all summer. Sales of all types of residential properties in August (1,430) were down 17.4% from July and down 10.7% from a year ago. The number of people offering their properties for sale also slowed but not as sharply as sales. There were 2,732 residential properties listed on the Multiple Listing Service® in August; down 2.2% from a month ago and down just 5.6% from a year ago. The available inventory was reduced 2.9% to 7,458 properties.
“Housing sales across Canada have dropped slightly since May,” said REALTORS® Association of Edmonton President Doug Singleton. “The sales activity varies from market to market and it appears, when compared to last year that Edmonton is slowing faster than the national trend after a very active spring. Never-the-less, housing prices are still up from a year ago and consumer confidence is high.”
Despite the slowdown in sales, prices were up as compared to August 2011. The average* selling price of a single family detached home (SFD) was down marginally (-0.15%) at $384,477 from last month but up 3.8% from a year ago. Condo prices were also down marginally (-0.9%) from last month at $237,042 but up from last year. The all residential average price was $334,395 (down 0.5% m/m) which is up 3.2% from August 2011.
Average prices are affected by the difference in price of similar properties as well as the market composition or mix of homes sold. Compared to a year ago, a typical bungalow in August sold for 2.2% more while a typical 2-story home sold for about 3.2% more. While the price of an individual home was rising, the market composition was also changing. In August 2012, 53% of SFDs sold were priced below $375,000 as compared to 59% in 2011. In addition, the number of sales of homes over $500,000 was up from 11% in 2011 to almost 15% this year.
“August sales illustrate the changes in the composition of the market,” said Singleton. “More consumers are purchasing homes at the higher end of the market. This is an indicator of consumer confidence and a long term view that this market is stable. ”
The average days-on-market in August was up two at 54 days. The sales-to-listing ratio was down, moving down from 62.0% in July to 52.3%.
Tags: appartment, buy house, buying, comfree, condo, edmonton, for sale, house, invest, market, MLS, real estate, REALTOR, search, selling
Posted in market update | Comments Off on Edmonton’s slower market activity matches national trend