
Posts Tagged ‘house’
Prices dip as result of higher inventory
Wednesday, August 5th, 2015July 2015 stats from Edmonton real estate board:
AVERAGE-DAYS-ON-MARKET–50-Days
SALES-TO-LISTING-RATIO–53%
HOMES-LISTED-FOR SALE-OVER $1M–190 homes
HOMES-SOLD-YTD-OVER $1M-70 homes
PRICES DIP AS RESULT OF HIGHER INVENTORY
статистика за июль 2015
количество дней на маркете –50-Days
отношение продаж к листингам –53%
количество домов, дороже миллиона на рынке –190 homes
количество ПРОДАННЫХ домов, дороже миллиона с начала года -70 homes
цены понизились из-за большого количества домов на рынке
Edmonton, AUGUST 4, 2015: Prices for all residential properties in the Edmonton for July were down from the previous month
.
The average all residential price was $372,910 (down 1.4% from June) due mostly to the drop in price of single family homes to $436,948 (down 1.8%). The drop was not felt across all categories with condo prices up 0.4% at an average of $256,708 and duplex/rowhouse prices up 1.4% from June at an average of $356,237.
While all residential average prices were down month over month, they still remained 3.3% higher than July of last year.
With reported all residential sales in July down 9.8% from June and down 2.8% from last year, average days on market is up to 50.
This is up from 46 average days on market in July 2014.
Single family dwellings spent an average of 48 days on market in July of 2015, duplex/rowhouses were at 43 days, and condos at 54 days.
“We have seen the biggest drop in condominium sales year to date at 14%. That drop coupled with an increase of condo listings of 17% explains why condos are taking longer on average to sell.
Some of these buyers may be moving over to duplex/townhouse options which is the only residential category showing an increase of sales of 6% year to date.”
There were 73 properties over a million dollars sold by this time last year, the exact same number as this year.
Inventory is still strong at 7,226 for the Edmonton CMA at the end of July 2015, up slightly from 7,177 in June and much higher than the 5,609 available in July of 2014.
All residential listings were up year over year by 14.9% but down month over month from June by 2.2%.
Edmonton Market , May 4, 2015
Tuesday, May 5th, 2015Residential sales in Edmonton’s Census Metropolitan Area (CMA) are beginning to pick up with 1,597 in April 2015. That is up 10% from 1,453 in March but still down 13% from April 2014. Reported reported sales are up for duplex/rowhouse – which are up this month over 24%. Single family sales were 1,001 – down 13% over last April (1,147 reported). Condos took the biggest hit down 20% over last year with 432 sold.
Despite a decline in all residential sales, the average sale price was $337,270 up 3% from April last year. Single family dwellings sold for an average of $438,641 (up 2% from last April), condos for $252,935 (up 0.2% y/y) and duplex/rowhouses were $356,022 (up 7.23% y/y).
The end of month residential active inventory was 6,784 for the Edmonton CMA. April residential new listings were up 11% from last year at 3,298. Average days on market were 44 compared to just 42 in April 2014.
| April 2015 | M/M % Change | Y/Y % Change | |
| SFD2 average3 selling price – month | $438,641 | -0.05% | 2.39% |
| SFD median4 selling price – month | $410,000 | -0.61% | 2.24% |
| Condominium average selling price | $252,935 | 1.24% | 0.21% |
| Condominium median selling price | $235,000 | 1.29% | 0.00% |
| All-residential5 average selling price | $377,270 | 1.14% | 3.13% |
| All-residential median selling price | $359,000 | -0.28% | 2.57% |
| # residential listings this month | 3,298 | 4.63% | 10.78% |
| # residential sales this month | 1,597 | 9.91% | -13.02% |
| # residential inventory at month end | 6,784 | 14.13% | 38.17% |
| # Total6 MLS® System sales this month | 2,082 | 12.18% | -21.14% |
| $ Value Total residential sales this month | $673 million | 12.90% | -18.83% |
| $ Value of total MLS® System sales – month | $792 million | 13.34% | -19.22% |
| $ Value of total MLS® System sales – YTD | $2.4 billion | 53.48% | -14.55% |
1 Census Metropolitan Area (Edmonton and surrounding municipalities)
2 Single Family Dwelling
3 The total value of sales in a category divided by the number of properties sold
4 The middle figure in a list of all sales prices
5 Residential includes SFD, condos and duplex/row houses.
6 Includes residential, rural and commercial sales
new listing- condo #230, 920-156 st – terwillegar
Wednesday, April 8th, 2015
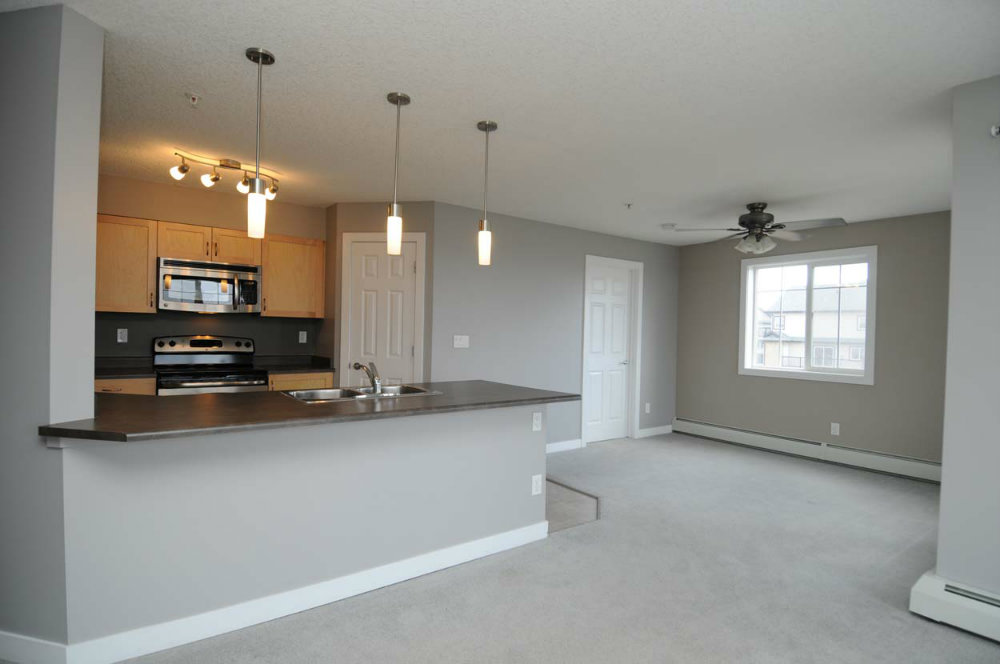
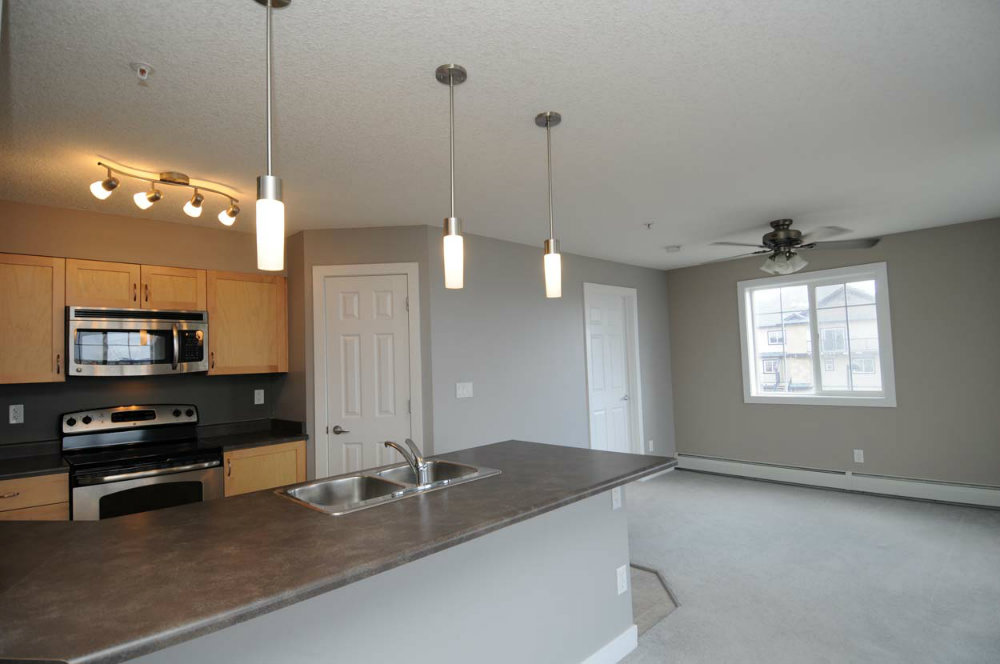
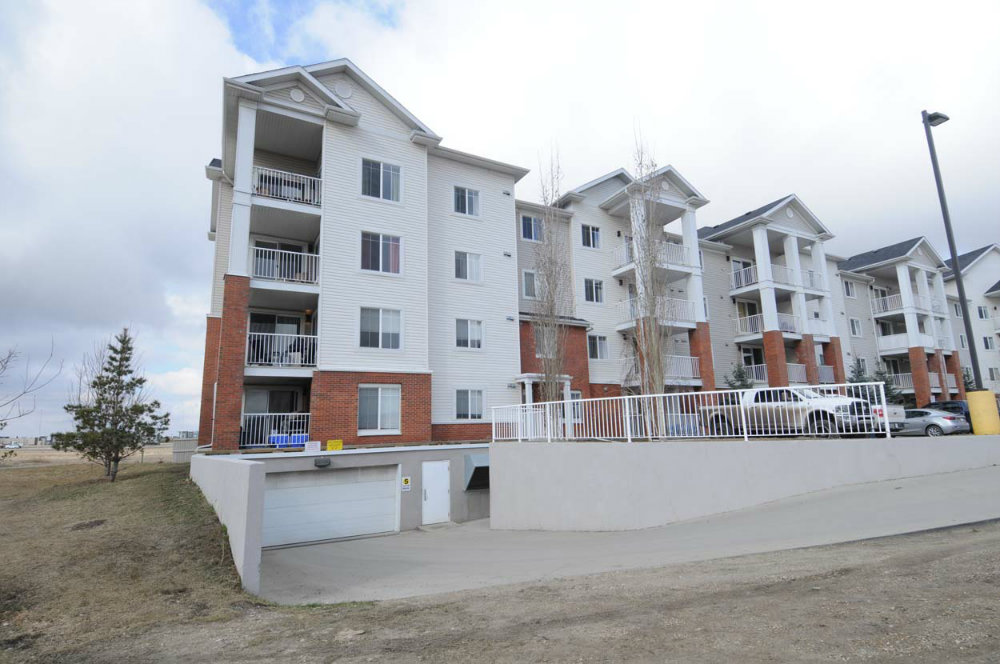
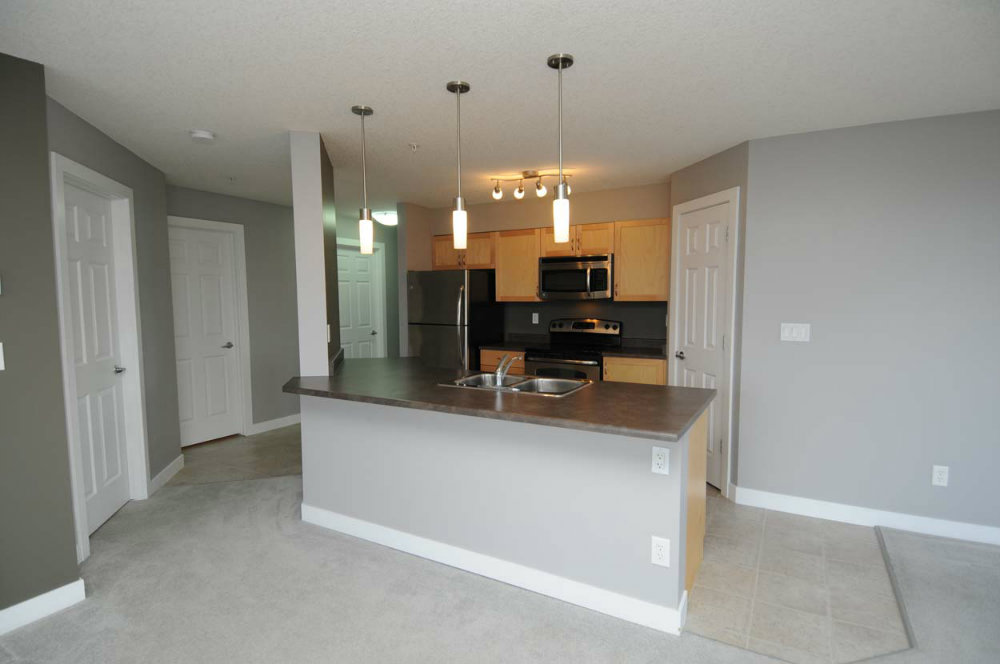
2 bedrooms 2full baths over 1000 sq ft unit on the second level. immaculate condition.
only 229,900
stop paying somebodies mortgage! pay yourself!
MLS® System Sales Up Over 11% in 2014
Tuesday, January 6th, 2015January 5, 2015: Sales of residential property through the Edmonton Multiple Listing Service® (MLS®) System in 2014 in the Edmonton CMA were over 11 percent higher than in 2013, exceeding growth expectations by a large margin. This increase was reflected across all property types including a 9.8% increase in sales of single family detached properties, an over 11% increase in condo sales and a 25.4% increase in duplex and rowhouse sales. There were 18,991 residential sales reported in 2014 as compared to 17,077 in 2013.
Prices were also up compared to 2013, with single family homes finishing the year 5.6% higher over last year at an average of $432,713. For 2014, the average price of a condo was $252,175 (up 4.5% from 2013) and the average price of all residential properties was $367,228 (up 5.2% from 2013).
2014 was a very busy year for your local REALTOR®. Edmonton and the surrounding areas experienced a great increase in volume of sales, but also a healthy increase in price. We did not see the sudden spikes in prices that we saw in 2007, but we did surpass the single family record price in March of 2014. An increase in newly built affordable condos and multifamily units coupled with historically low mortgage rates encouraged new buyers into the market. We also saw great migration into the province and a very tight rental market. These factors all play into a very active market in 2014.
The all-year sales-to-listing ratio was 70% (up 2% from 2013) with average days-on-market at 47 days (down from 53 last year). The active market was highlighted by a year-end inventory of just 3,059 properties, a similar number to the end of last year (3,049).
As is seasonally normal, prices and sales dropped in December from November, but are up year over year from December 2013 in all categories. The price of a single family detached property dropped 3.3% from $444,312 in November to $429,470 in December. Condo prices dropped 3.4% in December to $247,099 while duplex/row house prices increased slightly from November to $355,978. December all-residential unadjusted sales were exactly the same as 2013 at 770 and down almost 38% from last month.
If you have questions please talk to your local REALTOR® Irina Mierzewski about your options in this market and what is right for you!
-30-
| December 2014 | M/M % Change | Y/Y % Change | |
| SFD2 average3 selling price – month | $429,470 | -3.30% | 1.80% |
| SFD median4 selling price – month | $399,900 | -2.40% | 4.30% |
| Condominium average selling price | $247,099 | -3.40% | 5.50% |
| Condominium median selling price | $220,000 | -5.60% | 0.50% |
| All-residential5 average selling price | $359,479 | -5.80% | 3.20% |
| All-residential median selling price | $343,500 | -3.90% | 5.70% |
| # residential listings this month | 932 | -34.20% | 19.80% |
| # residential sales this month (reported) | 770 | -37.90% | 0% |
| # residential inventory at month end | 3,059 | -21.70% | 0.30% |
| # Total6 MLS® System sales this month | 1001 | -32.70% | 0.90% |
| $ Value Total residential sales this month | $315 million | -34.20% | -1.72% |
| $ Value of total MLS® System sales – month | $367 million | -35.20% | 1.00% |
| $ Value of total MLS® System sales – YTD | $9.4 billion | 4.60% | 15.10% |
Just Listed 925-116 street NW Edmonton
Thursday, November 6th, 2014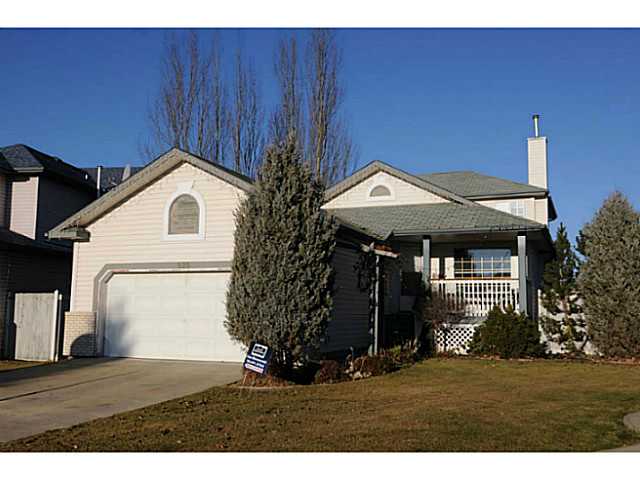
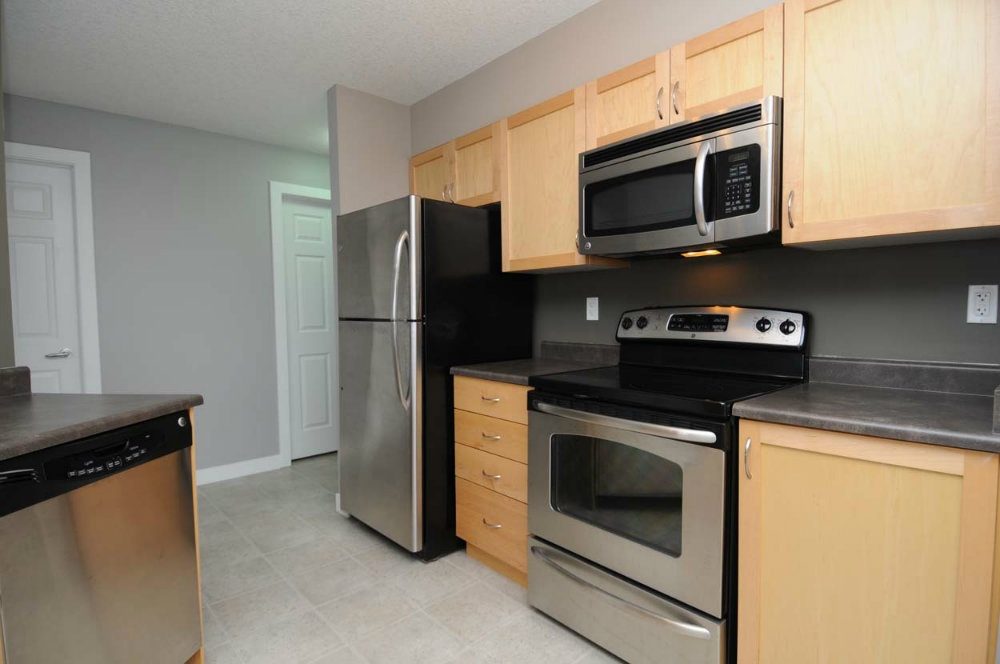
Best Priced property in Twinbrooks-1996y.built 2storey,1860 sq ft.2 living rooms on main, spacious kitchen with island, open concept floor plan, vaulted ceiling, sun room, 3bedrms up+1 down, 2 full baths, double Attchd Garage and fully fenced and landscaped NW HUGE backyard (over 11,800 sq ft pie shaped lot)! Plenty of kitchen cabinets&counter space! Upper level offers 3 great size bdrms. Professionally developed bsmnt by the builder with HUGE rec room and a bedroom – a great addition for older kids! Tons of storage! Tucked away from busy traffic,it’s the PERFECT property for raising your family in the SAFE&friendly Twin brooks – kids activities,playgrounds, one of the best elementary school – G.P. Nicolson, amazing shopping,grocery,banking,dental,hair,medicentre! 5 min bus ride to LRT! fast route to UofA. A.Henday and only 15 min to YEG airport!
Market begins seasonal cool off a little later this year
Tuesday, November 4th, 2014The Edmonton area has been blessed with a beautiful fall and the local housing market has followed the weather trend. The fall months always tend to be a quieter market, but this year sales remained strong a little longer than usual. Edmonton Census Metropolitan Area (CMA) total residential average prices remain stable (up 8.5% over last year) thanks in part to an incline in sales of higher priced houses.
The seasonal slide is reflected in the dip in single family sales, down 12% from last month at 850 sold (918 adjusted). While still up almost 8% from last year, single family prices dipped down from $436,870 in September to $426,848 in October, a difference of 2.3%.
With an average price of $260,491, condos actually gained a bit of momentum going up 2.6% month-over-month and 9.75% year-over-year. Duplex/row house prices were also up month-over-month at $352,907.
In October, 2,049 residential properties were listed which is up 18.6% from last year. 1,412 were reported sold (1,525 adjusted) in the Edmonton CMA. Total days on market for all residential properties were down 3 days over October of 2013.
The demand for single family homes in the $350,000 to $400,000 remains high with 185 properties selling in this range in October. However, inventory is tight at the $350,000 to $400,000 mark with only 227 available properties available as of October 31. We have seen a lot of action this year in houses under $400,000. People may need to adjust their expectations when looking at houses in this range. There is a big demand for properties at this price point and with a light inventory, you may need to wait a bit longer to find the right house for you.
Another “hot” market is houses priced over a million dollars. We have seen this trend throughout 2014. Almost 2% of the single family dwellings sold last month were over a million dollars. Compare that to last October where less than one quarter of 1% of the sales were over a million. 125 million dollar plus homes have sold in 2014 compared to 94 at this same time last year and 75 in 2012.
Fall Maintains Summer Heat in Edmonton Market
Thursday, October 2nd, 2014
Reports of the impending burst of the so called “housing bubble” have homeowners looking closer at housing prices this month. While it makes for an exciting story, the numbers just don’t back up the claim. Edmonton Census Metropolitan Area (CMA) continues to see the stable market we have enjoyed over the past few years.
The steady gain year-over-year in housing prices is reflective of a stable and strong market. Average prices, listings, and sales are all up from September of last year. The average days on market for residential properties remained the same as August at 49 (down from 54 days the same time last year). While inventory is still down 6% from September 2013.
The average price for a single family dwelling (SFD) in Edmonton in September stayed strong at $435,584 (down a mere 0.04% from August). Condos were down 3% month over month at an average selling price of $254,494. Duplex/row house prices were up 0.3% to $350,983 and the total residential average price was up 0.8% from August at $372,673.
In September, 2,193 residential properties were listed and 1,568 were reported sold (1,693 adjusted). Single family dwelling reported sales were up 4.7% from last month at 967 (1,044 adjusted) while condos were down 3.6% at 452 (488 adjusted).
We normally see a decrease in sales and average price when fall arrives. The strong market we saw in August continued on into September with surprisingly little to no changes in prices. There is a false idea out there that people only buy houses in the spring and summer. People buy and sell their houses when the time is right for them. Consulting with your Russian Ukrainian speaking local REALTOR – Irina Mierzewski – is the best way to see if the time is right for you.
The number of homes listed for sale in September was 8% higher than the same month last year. The sales-to-listing ratio was 72%: up from 67% last month.
| September 2014 | M/M % Change | Y/Y % Change | |
| SFD2 average3 selling price – month | $435,584 | -0.04% | 6.92% |
| SFD median4 selling price – month | $405,000 | 0.56% | 6.91% |
| Condominium average selling price | $254,494 | -2.94% | 4.85% |
| Condominium median selling price | $232,000 | 1.53% | 2.65% |
| All-residential5 average selling price | $372,673 | 0.83% | 6.37% |
| All-residential median selling price | $350,000 | 0.32% | 4.28% |
| # residential listings this month | 2,193 | -4.74% | 8.08% |
| # residential sales this month (reported) | 1,568 | -7.66% | 9.19% |
| # residential inventory at month end | 4,812 | -9.79% | -5.85% |
| # Total6 MLS® System sales this month | 2,122 | 4.17% | 6.47% |
| $ Total value MLS® System residential sales – month | $668 million | 3.24% | 13.15% |
| $ Total value MLS® System sales – month | $788 million | 4.95% | 13.67% |
| $ Total value MLS® System sales – YTD | $7.6 billion | 12.82% | 16.05% |
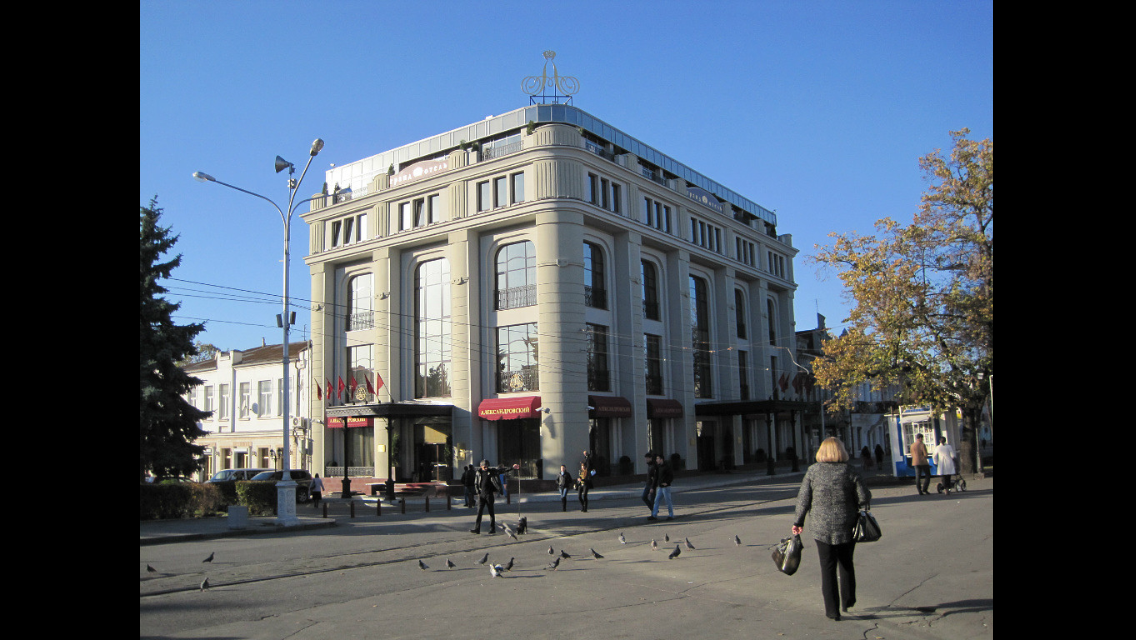
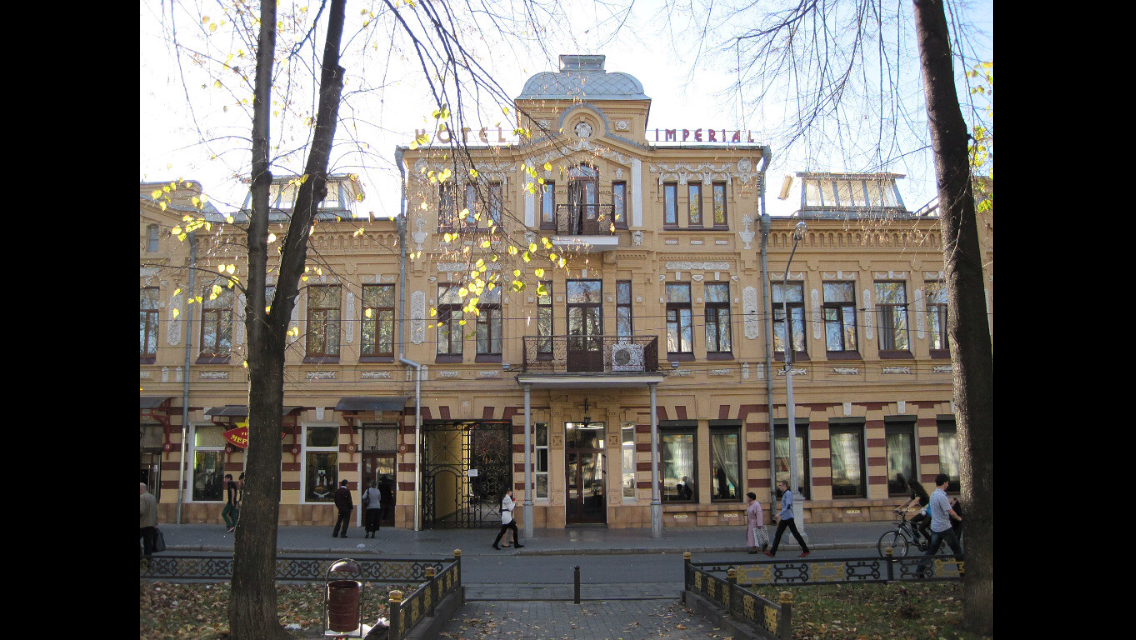
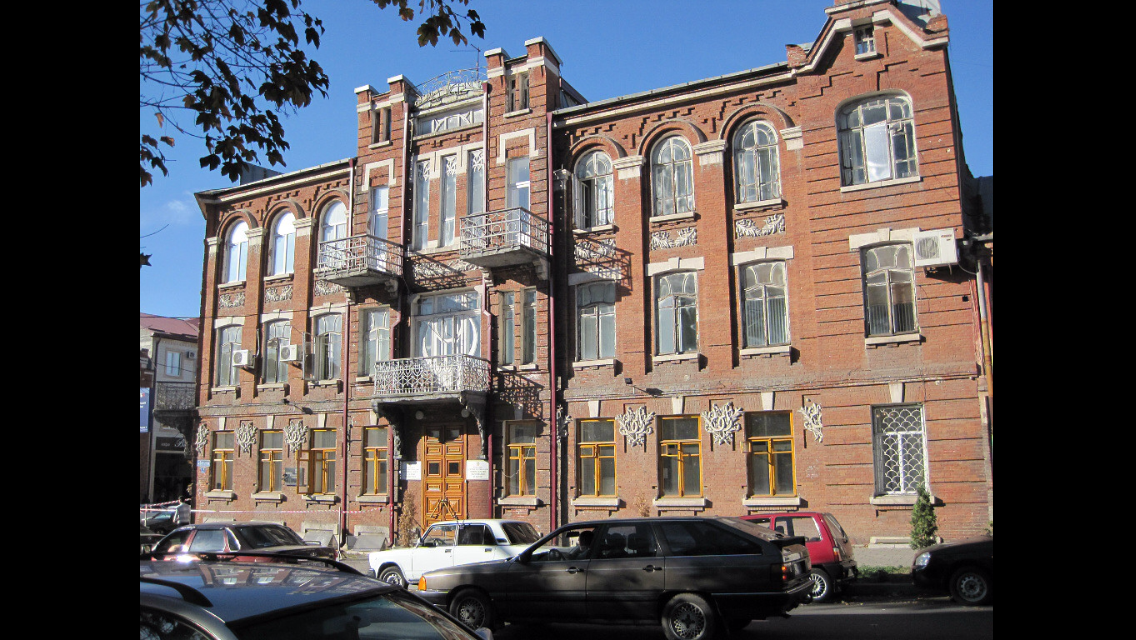
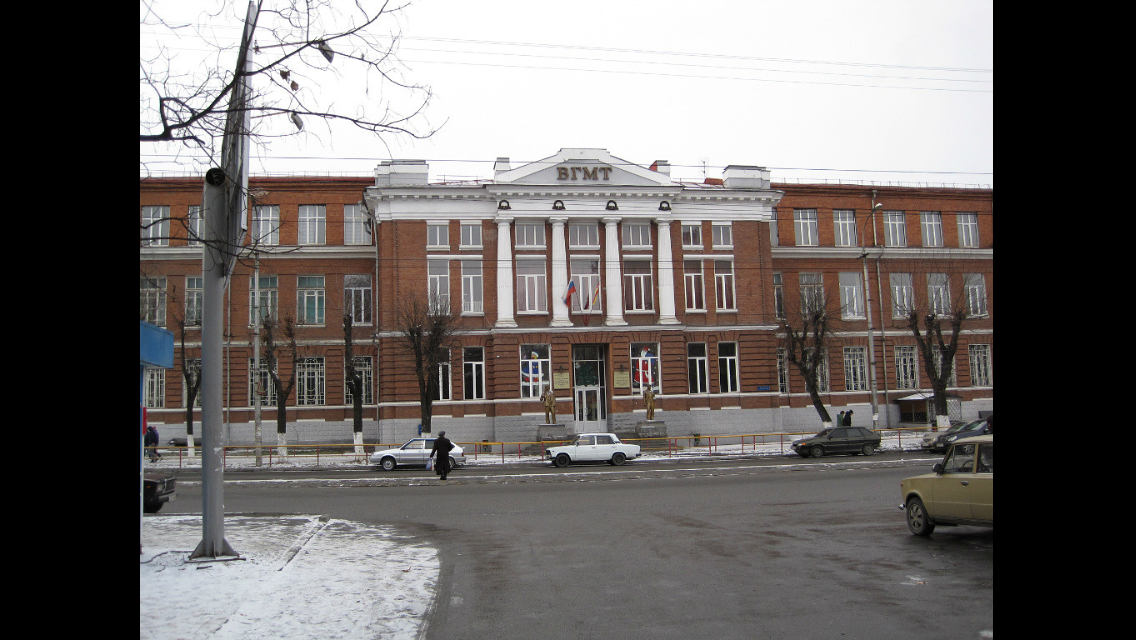
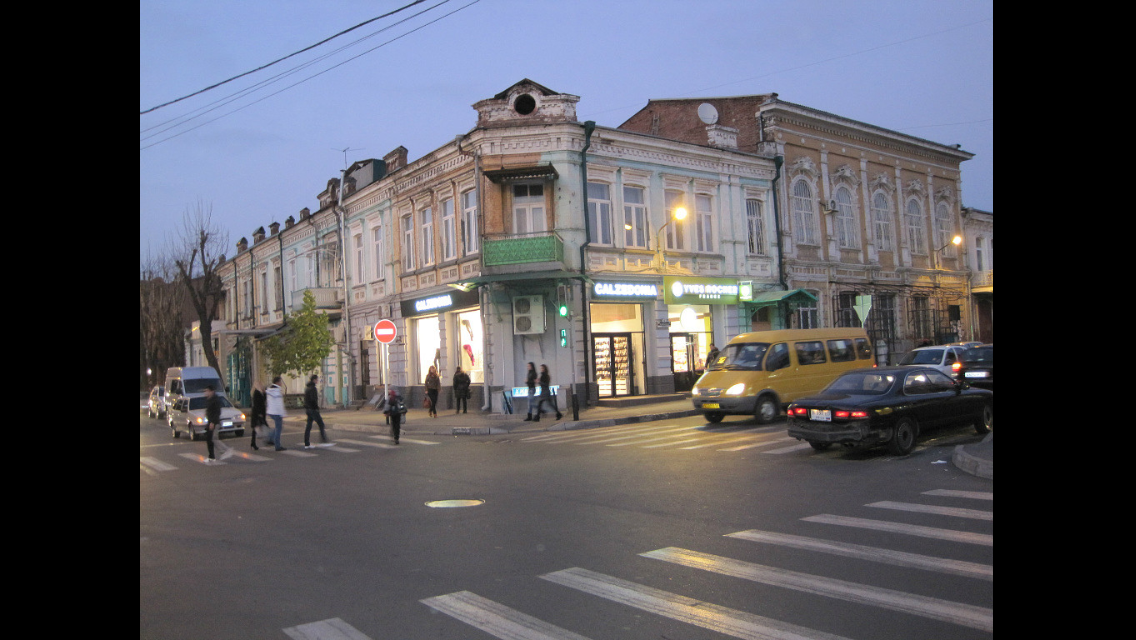
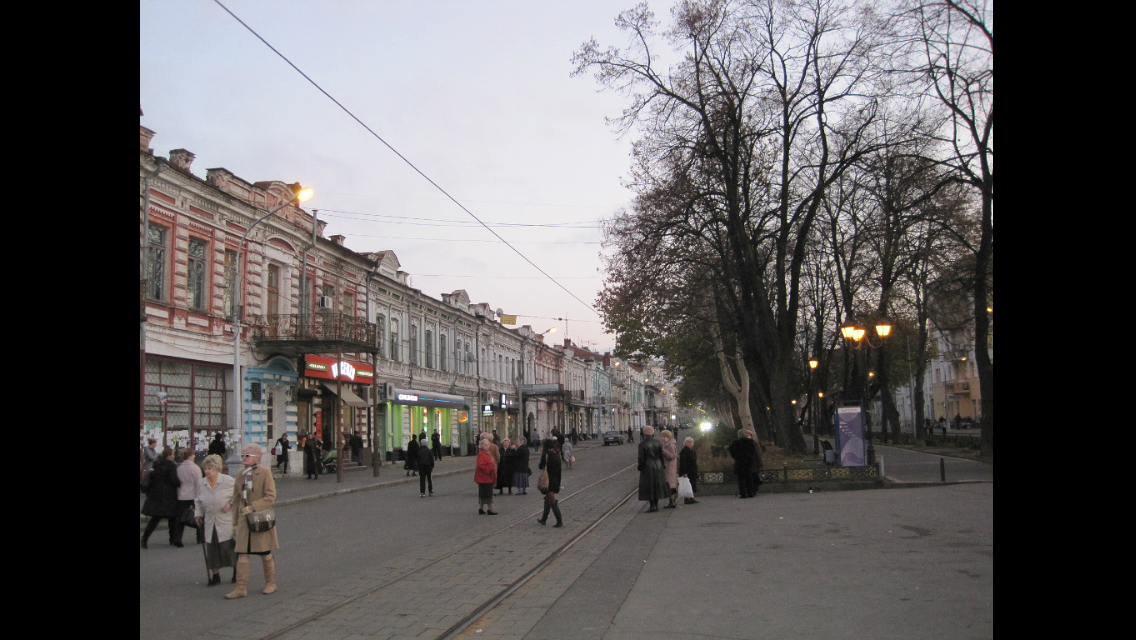
Мой город- ВЛАДИКАВКАЗ! My city – Vladikavkaz!
Monday, September 22nd, 2014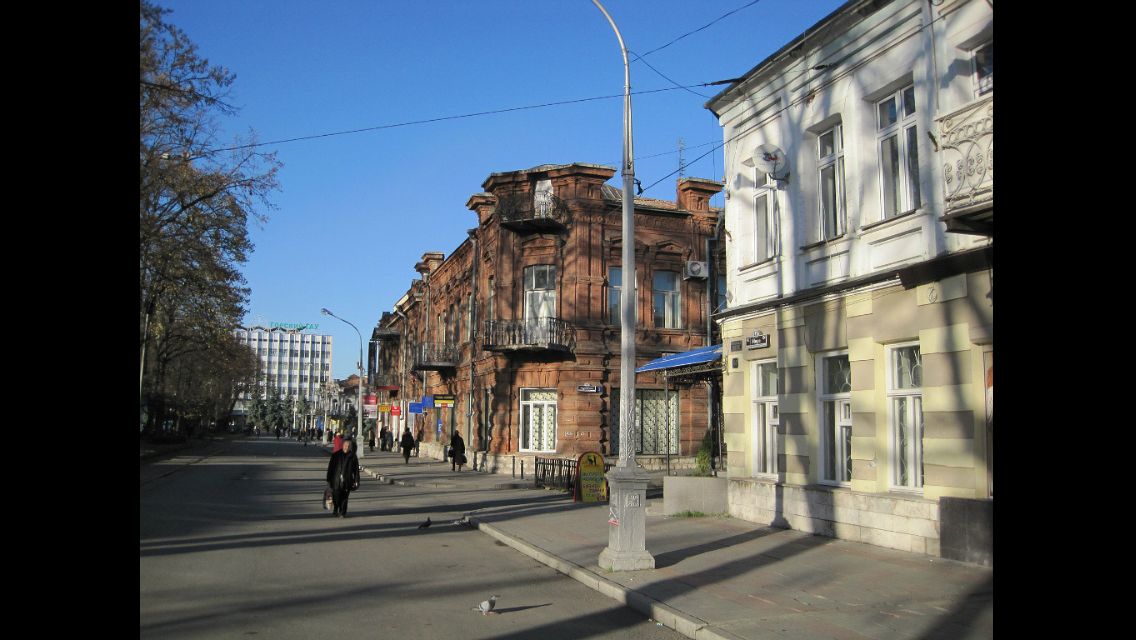
The city was founded in 1784[7] as a fortress during the Russian conquest of the Caucasus and was for many years the main Russian military base in the region.
The Georgian Military Highway, crossing the mountains, was constructed in 1799 to link the city with Georgia to the south, and in 1875 a railway was built to connect it to Rostov-on-Don andBaku in Azerbaijan. Vladikavkaz has become an important industrial center for the region, with smelting, refining, chem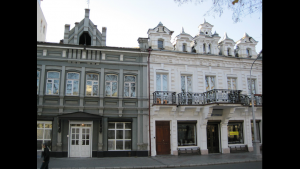 icals and manufacturing industries.


From 1931 to 1944 and from 1954 to 1990, its name in both Russian and Ossetic languages was Ordzhonikidze (Орджоники́дзе) (afterSergo Ordzhonikidze, a Georgian Bolshevik), and from 1944 to 1954 it was officially called Dzaudzhikau (Дзауджика́у) in Russian andDzæwdžyqæw (Дзæуджыхъæу) in Ossetic. Vladikavkaz resumed its old Russian name, in 1990, shortly before the dissolution of the Soviet Union; the official Ossetic name was reverted to Dzæwdžyqæw.
Vladikavkaz was fought over in both the Russian Civil War and World War II. In February 1919, the anti-Communist Volunteer Army under General Anton Denikin seized the city, before being expelled by the Red Army in March 1920. In November 1942, the forces of Nazi Germany tried unsuccessfully to seize the city but were repelled.
In 1999, 2008, and 2010, Vladikavkaz was a target of bombings.
Ethnic groups in the city (2002 data):[citation needed]
| Climate data for Vladikavkaz | |||||||||||||
|---|---|---|---|---|---|---|---|---|---|---|---|---|---|
| Month | Jan | Feb | Mar | Apr | May | Jun | Jul | Aug | Sep | Oct | Nov | Dec | Year |
| Record high °C (°F) | 19.6 (67.3) |
23.0 (73.4) |
30.3 (86.5) |
34.0 (93.2) |
35.0 (95) |
38.0 (100.4) |
37.5 (99.5) |
39.2 (102.6) |
38.2 (100.8) |
33.5 (92.3) |
27.0 (80.6) |
27.1 (80.8) |
39.2 (102.6) |
| Average high °C (°F) | 3.0 (37.4) |
3.2 (37.8) |
7.7 (45.9) |
14.8 (58.6) |
19.4 (66.9) |
23.2 (73.8) |
25.7 (78.3) |
25.4 (77.7) |
20.8 (69.4) |
15.1 (59.2) |
8.4 (47.1) |
4.3 (39.7) |
14.3 (57.7) |
| Daily mean °C (°F) | −1.9 (28.6) |
−1.7 (28.9) |
3.0 (37.4) |
9.5 (49.1) |
14.1 (57.4) |
18.0 (64.4) |
20.6 (69.1) |
20.1 (68.2) |
15.6 (60.1) |
9.8 (49.6) |
3.6 (38.5) |
−0.7 (30.7) |
9.2 (48.6) |
| Average low °C (°F) | −5.6 (21.9) |
−5.7 (21.7) |
−0.9 (30.4) |
5.1 (41.2) |
9.6 (49.3) |
13.5 (56.3) |
16.1 (61) |
15.7 (60.3) |
11.2 (52.2) |
5.7 (42.3) |
0.1 (32.2) |
−4.2 (24.4) |
5.1 (41.2) |
| Record low °C (°F) | −27.2 (−17) |
−27.8 (−18) |
−22.0 (−7.6) |
−8.9 (16) |
−2.8 (27) |
2.2 (36) |
7.5 (45.5) |
6.0 (42.8) |
0.0 (32) |
−10.0 (14) |
−22.2 (−8) |
−25.0 (−13) |
−27.8 (−18) |
| Precipitation mm (inches) | 31 (1.22) |
34 (1.34) |
54 (2.13) |
85 (3.35) |
140 (5.51) |
175 (6.89) |
109 (4.29) |
89 (3.5) |
75 (2.95) |
60 (2.36) |
46 (1.81) |
31 (1.22) |
929 (36.57) |
| Avg. precipitation days | 6 | 6 | 8 | 10 | 14 | 14 | |||||||
Housing prices begin seasonal slide, but rise over 2013
Tuesday, August 5th, 2014Edmonton, August 5, 2014:
The Single Family Detached (SFD) average price in July was down 2% from June at $426,716 and the All Residential average price was off 2.6% from June at $362,091 in the Edmonton . Condo prices were stable month-over-month at $254,654 and duplex/rowhouse average prices rallied with a 5% lift to $360,309.
Residential sales were up year-over-year from 1,835 in July 2013 to 2,013 (up 9.7%) with SFD sales (1,179) up compared to the same month last year by 4.8%.
Condo sales of 639 units were up 15.4% and duplex/row house sales were up 27.7% compared to July 2013.
There is adequate supply with over 5,600 residential properties in inventory.
The average days-on-market was up slightly to 46 days in July as compared to 41 days in June. The sales-to-listing ratio was 69%: slower than the 75% last July.
If you are looking to buy or sell your property – call Irina Mierzewski – your english ukrainian russian speaking realtor in edmonton and she will be happy to answer all your questions and assist you in all your real estate needs! please read testimonials on her page and see what other clients are saying about her and her professional real estate expertise .
| M/M % Change | Y/Y % Change | ||
| SFD2 average3 selling price – month | $426,716 | -2.00% | 3.90% |
| SFD median4 selling price – month | $396,000 | -4.00% | 3.10% |
| Condominium average selling price | $254,654 | 0.20% | 4.60% |
| Condominium median selling price | $239,000 | 0.00% | 6.20% |
| All-residential5 average selling price | $362,091 | -2.60% | 3.30% |
| All-residential median selling price | $345,000 | -3.90% | 3.00% |
| # residential listings this month | 2,718 | -8.10% | 10.60% |
| # residential sales this month (reported) | 1,864 | -12.70% | 1.60% |
| # residential inventory at month end | 5,609 | -1.70% | -3.90% |
| # Total6 MLS® System sales this month | 2,570 | -1.95% | 4.10% |
| $ Total value MLS® System residential sales – month | $786 million | -6.10% | 5.70% |
| $ Total value MLS® System sales – month | $948 million | -4.40% | 9.40% |
| $ Total value MLS® System sales – YTD | $5.9 billion | 20.90% | 16.50% |
