new listing- condo #230, 920-156 st – terwillegar
Wednesday, April 8th, 2015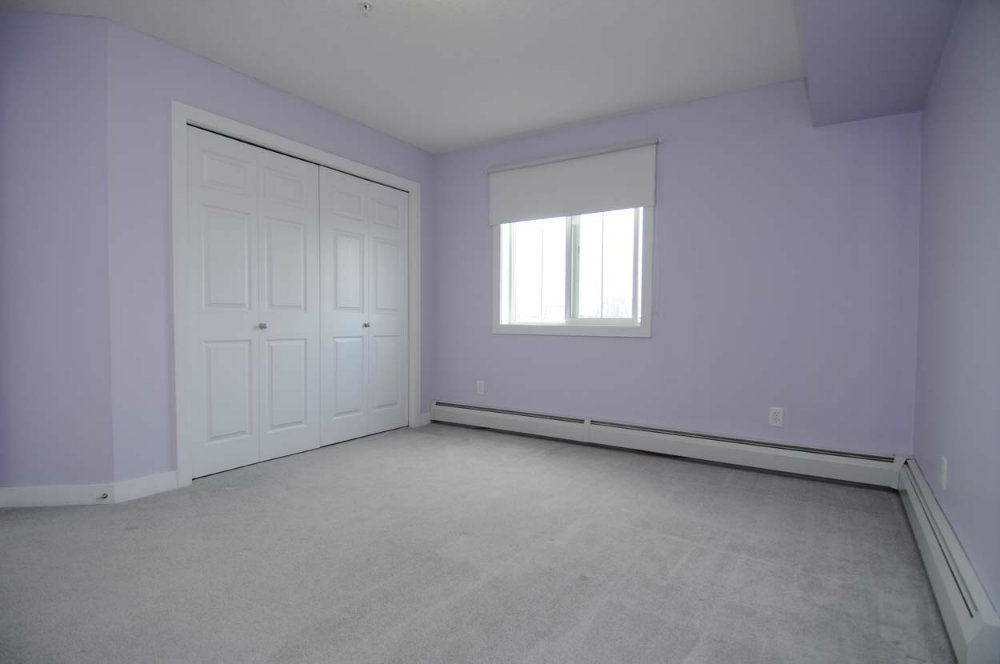
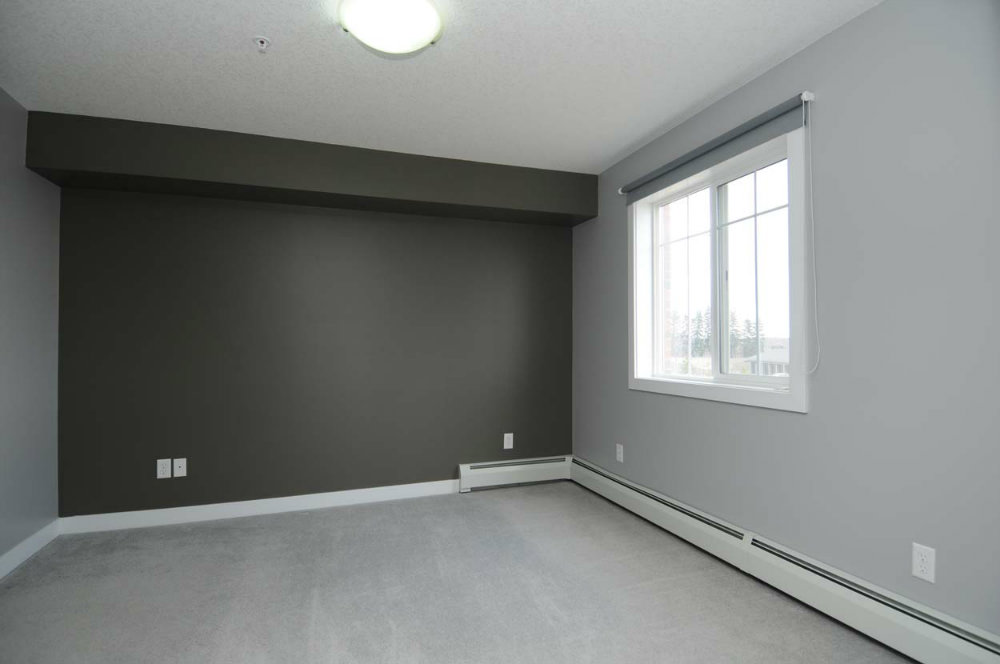
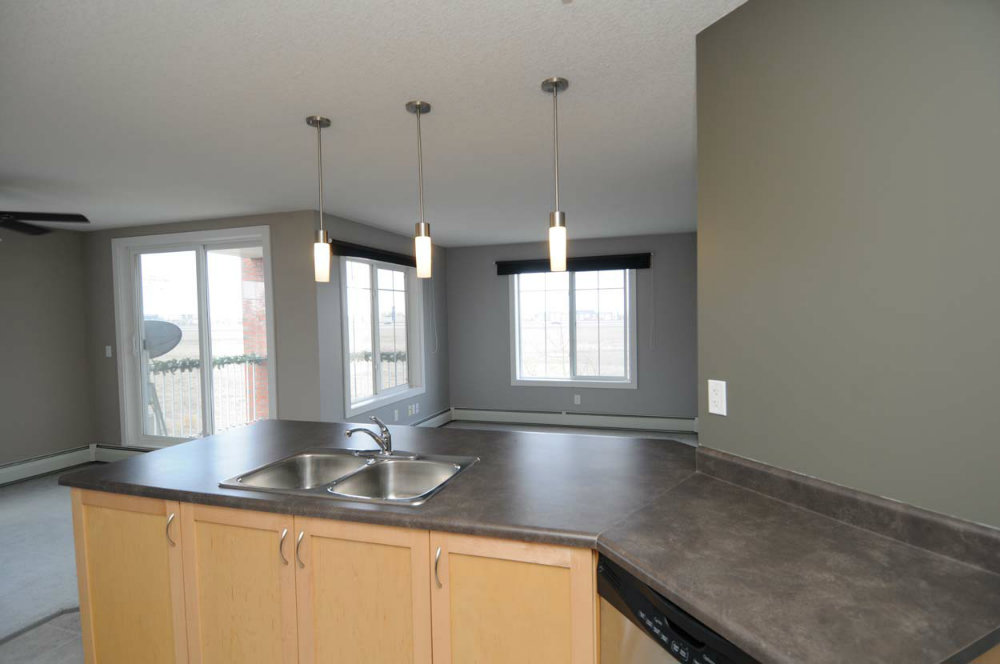
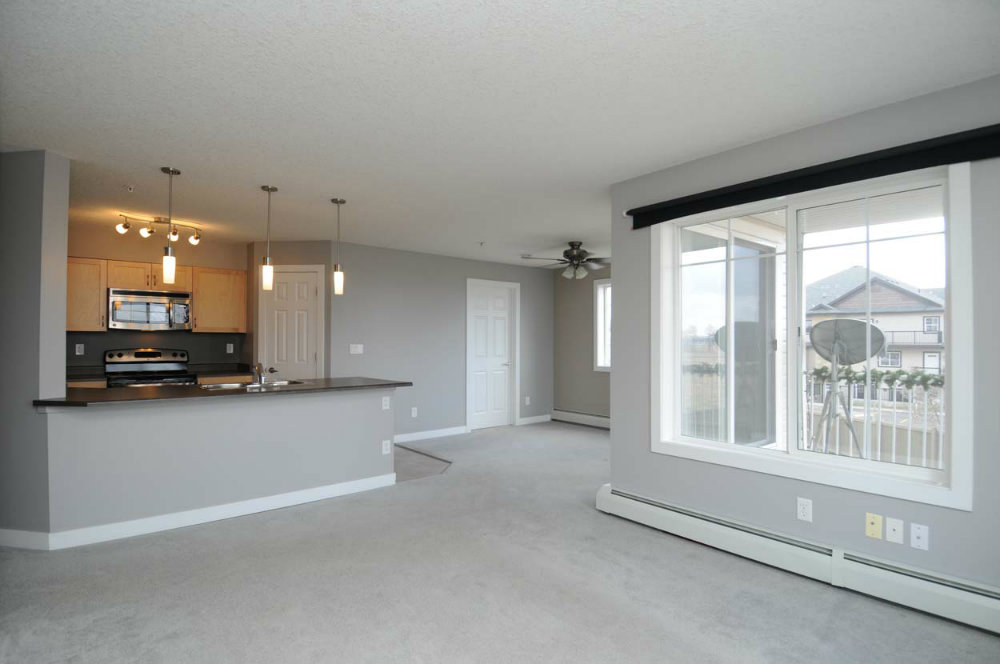
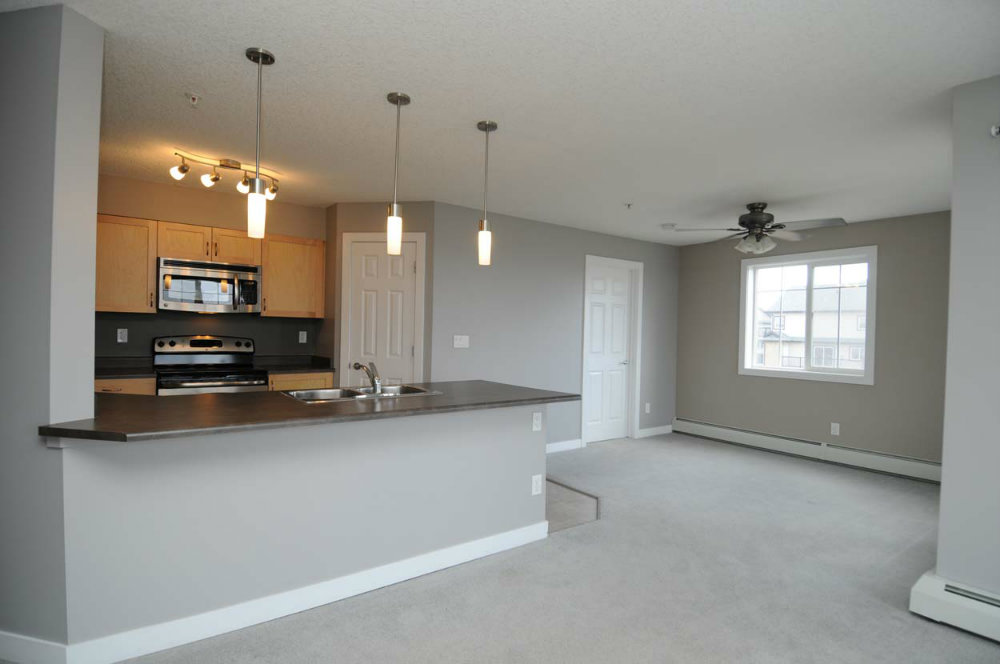
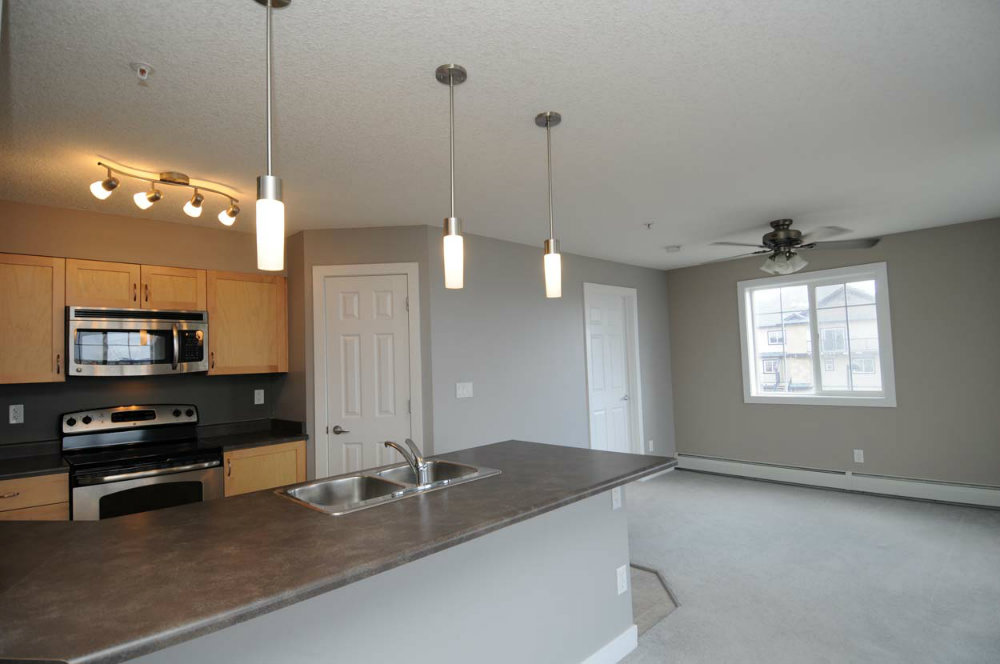
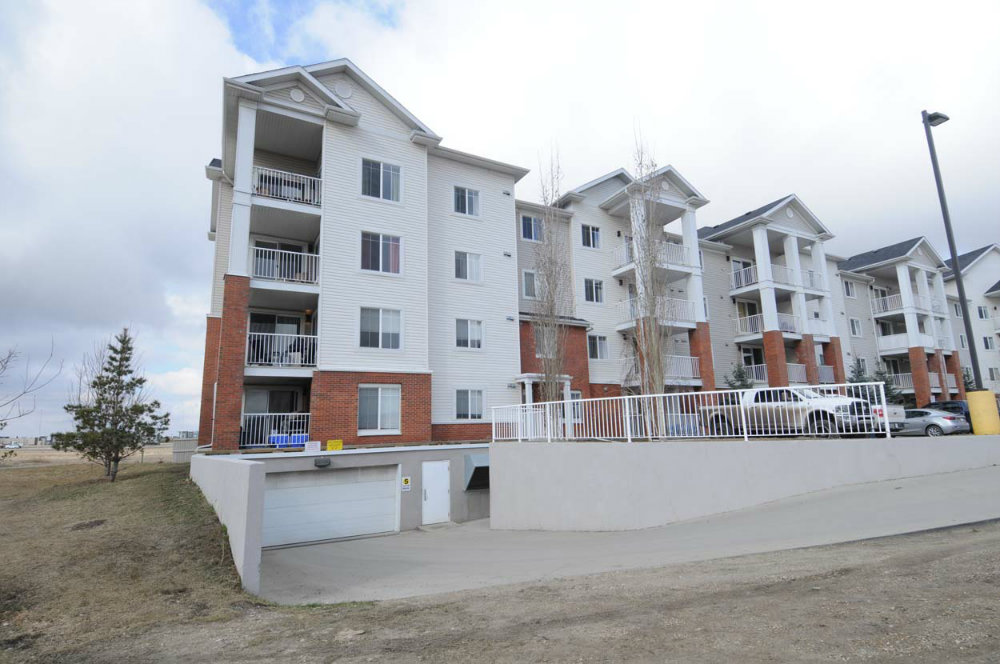
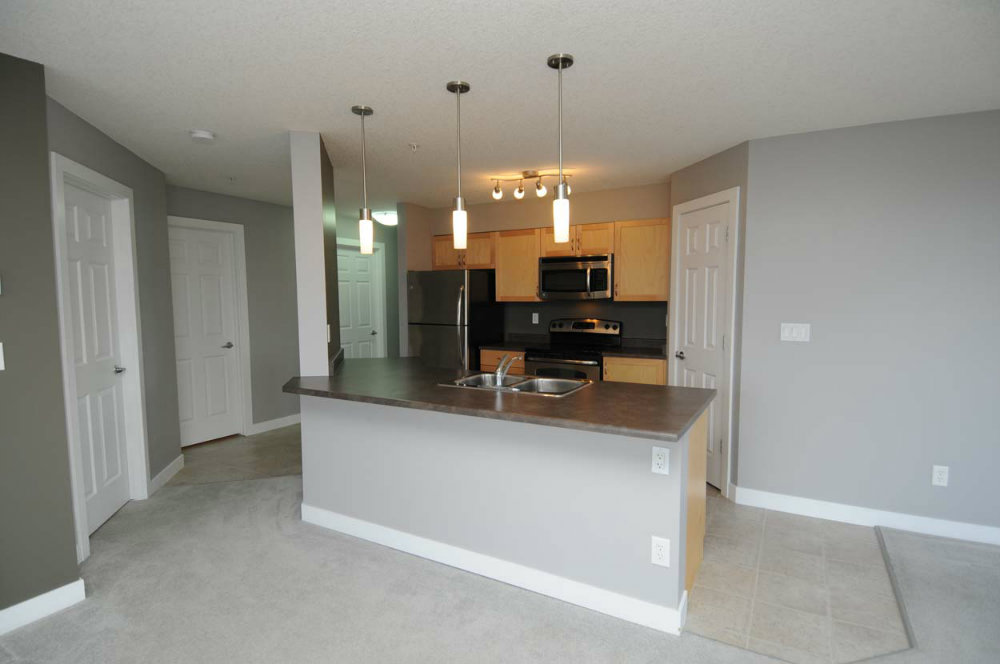
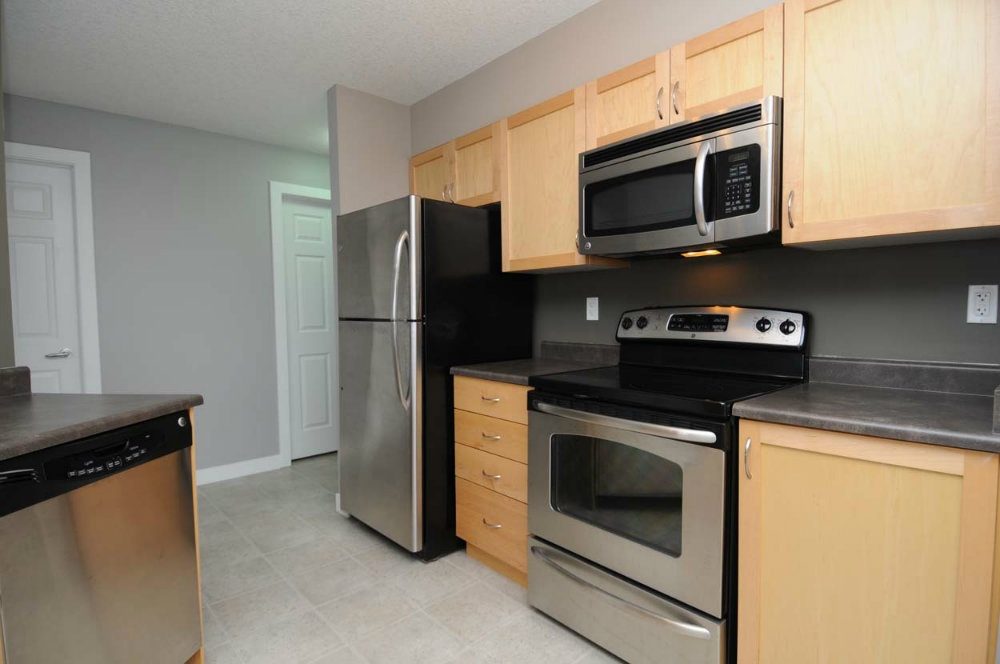
2 bedrooms 2full baths over 1000 sq ft unit on the second level. immaculate condition.
only 229,900
stop paying somebodies mortgage! pay yourself!

2 bedrooms 2full baths over 1000 sq ft unit on the second level. immaculate condition.
only 229,900
stop paying somebodies mortgage! pay yourself!
The Edmonton area has been blessed with a beautiful fall and the local housing market has followed the weather trend. The fall months always tend to be a quieter market, but this year sales remained strong a little longer than usual. Edmonton Census Metropolitan Area (CMA) total residential average prices remain stable (up 8.5% over last year) thanks in part to an incline in sales of higher priced houses.
The seasonal slide is reflected in the dip in single family sales, down 12% from last month at 850 sold (918 adjusted). While still up almost 8% from last year, single family prices dipped down from $436,870 in September to $426,848 in October, a difference of 2.3%.
With an average price of $260,491, condos actually gained a bit of momentum going up 2.6% month-over-month and 9.75% year-over-year. Duplex/row house prices were also up month-over-month at $352,907.
In October, 2,049 residential properties were listed which is up 18.6% from last year. 1,412 were reported sold (1,525 adjusted) in the Edmonton CMA. Total days on market for all residential properties were down 3 days over October of 2013.
The demand for single family homes in the $350,000 to $400,000 remains high with 185 properties selling in this range in October. However, inventory is tight at the $350,000 to $400,000 mark with only 227 available properties available as of October 31. We have seen a lot of action this year in houses under $400,000. People may need to adjust their expectations when looking at houses in this range. There is a big demand for properties at this price point and with a light inventory, you may need to wait a bit longer to find the right house for you.
Another “hot” market is houses priced over a million dollars. We have seen this trend throughout 2014. Almost 2% of the single family dwellings sold last month were over a million dollars. Compare that to last October where less than one quarter of 1% of the sales were over a million. 125 million dollar plus homes have sold in 2014 compared to 94 at this same time last year and 75 in 2012.
The City of Edmonton has grown by over 60,000 people in the past two years according to the recent municipal census. Surrounding communities are also growing because of the strength of the Alberta economy. The pressure on housing is forcing real estate prices and sales volumes up and shortening the time it takes to sell a home.
The total value of residential real estate sales through the Edmonton Multiple Listing Service (MLS®) System has increased almost 14% compared to the same time last year. New arrivals to Edmonton have pushed the number of homes sold so far this year up from 13,377 to 14,858; an 11% increase. Average days on market was just 49 days in August compared to 53 last year.
The average price for a single family dwelling (SFD) in the Edmonton CMA in August was $435,430 (up 1.9% over July) and condos sold on average for $262,273; a 3.1% increase. Duplex/row house prices were down 2.7% to $349,590 which limited the average all-residential sales price to a 2.0% increase at $368,597 in August compared to July.
In the last half of the summer, residential sales were down compared to July from 1,999 to 1,552 units. Single family sales were down 15.4%, condo sales were down 20.8% and duplex/rowhouse sales were down 11.8% in the month. Total sales were down 6.0% when compared to August 2013.
We move into the fall with 5,334 residential properties in the inventory and a vibrant market. Homebuyers and sellers are encouraged to work closely with your REALTOR® for LIFE! Irina Mierzewski to find a suitable home in their preferred neighbourhood and price range.
The number of homes listed for sale in August was 4.2% higher than the same month last year. The sales-to-listing ratio was 67%: slower than the 75% last August.
-30-
| August 2014 | M/M % Change | Y/Y % Change | |
| SFD2 average3 selling price – month | $435,430 | 1.90% | 4.30% |
| SFD median4 selling price – month | $402,750 | 1.70% | 5.80% |
| Condominium average selling price | $262,273 | 3.10% | 7.50% |
| Condominium median selling price | $228,500 | -4.40% | -0.60% |
| All-residential5 average selling price | $368,597 | 2.00% | 5.00% |
| All-residential median selling price | $348,900 | 1.10% | 5.70% |
| # residential listings this month | 2,305 | -15.20% | 4.20% |
| # residential sales this month (reported) | 1,552 | -22.40% | -6.00% |
| # residential inventory at month end | 5,334 | -4.90% | -4.00% |
| # Total6 MLS® System sales this month | 2,037 | -6.80% | -6.90% |
| $ Total value MLS® System residential sales – month | $647 million | -17.60% | -2.20% |
| $ Total value MLS® System sales – month | $751 million | -4.50% | 3.30% |
| $ Total value MLS® System sales – YTD | $6.7 billion | 13.80% | 15.00% |
1 Census Metropolitan Area (Edmonton and surrounding municipalities)
2 Single Family Dwelling
3 The total value of sales in a category divided by the number of properties sold
4 The middle figure in a list of all sales prices
5 Residential includes SFD, condos and duplex/row houses.
6 Includes residential, rural and commercial sales
3 Average prices indicate market trends only. They do not reflect actual changes for a particular property, which may vary from house to house and area to area. Prior period sales figures have been adjusted to include late reported sales and cancellations and therefore reflect a more accurate view of the period than previously reported at month end. The RAE trading area includes communities beyond the CMA (Census Metropolitan Area) and therefore average and median prices may include sold properties outside the CMA. For information on a specific area, contact Irina Mierzewski – your Russian/Ukranian Speaking Realtor in Edmonton.
The housing market in the Edmonton is poised for a very active spring sales period. Sales of all types of residential properties in the first quarter in the Edmonton were up 5.8% as compared to the same period in 2013. Single family detached (SFD) sales were up 5.1% while condo sales rose a staggering 11.0% in the first quarter.
We expect that sales will increase from month-to-month as we approach the second quarter. But this year-over-year increase is an indicator of the high demand for housing in this market. Price rises will follow the demand and we can expect active competition for desirable properties.
There were 3,679 all-residential sales from January to March 2014 compared to 3,478 sales in 2013. SFD sales rose from 2,099 to 2,206 while condo sales in the first quarter jumped from 996 to 1,106. Listings also rose to fill the demand. There were 6,324 residential properties listed so far this year compared to 6,086 last year; an increase of 3.9%. Listings of SFDs rose 5.5% Y/Y while condo listings dipped by half of one percent. The overall sales-to-listing ratio in the first quarter was 58% compared to 57% last year. which means that 5.8 houses out of 10 are selling.
Despite the increase in Y/Y listings the available inventory at the end of March was down 6.9% at 4,413 residential properties as compared to March 2013. The turn-around time on sales reflected the busy marketplace with average days-on-market in March at 44 days; down from 51 in March 2013.
Strong sales indicate consumer confidence in the Edmonton marketplace, The high condo sales and low condo listings indicate the demand for lower priced properties and first time buyers are choosing condos as an option to lower-priced SFDs which are in high demand and short supply. REALTOR® figures do not include the sale of many new homes and condos which are sold directly by builders and not through the Multiple Listing Service® (MLS®).
Overall, month-over-month average sale prices were stable. The all-residential price moved down less than half of one percent from $363,281 to $361,870. SFD average prices were also down fractionally from $433,205 to $432,458 and condos saw price increases of 3.6% from $238,376 to $247,005 on average. Duplex/row house prices were down from $338,024 in February to $331,038 in March.
| March | M/M % Change | Y/Y % Change | |
| SFD2 average3 selling price – month | $432,458 | -0.20% | 3.00% |
| SFD median4 selling price – month | $399,900 | 1.90% | 5.20% |
| Condominium average selling price | $247,005 | 3.60% | 0.00% |
| Condominium median selling price | $230,000 | 2.30% | 0.20% |
| All-residential5 average selling price | $361,870 | -0.40% | 1.50% |
| All-residential median selling price | $341,500 | 1.00% | 3.50% |
| # residential listings this month | 2,584 | 33.80% | 9.10% |
| # residential sales this month (reported) | 1,554 | 27.00% | 3.60% |
| # residential inventory at month end | 4,413 | 13.00% | -6.90% |
| # Total6 MLS® System sales this month | 1,996 | 36.30% | 0.20% |
| $ Total value MLS® System residential sales – month | $642 mil | 38.90% | 3.50% |
| $ Total value MLS® System sales – month | $718 mil | 34.60% | 2.40% |
| $ Total value MLS® System sales – YTD | $1.732 bil | 80% | 6.90% |

| The data included on this website is deemed to be reliable, but is not guaranteed to be accurate by the REALTORS® Association of Edmonton. The trademarks REALTOR®, REALTORS® and the REALTOR® logo are controlled by The Canadian Real Estate Association (CREA) and identify real estate professionals who are members of CREA. Used under license. |
|