Posts Tagged ‘buy house’
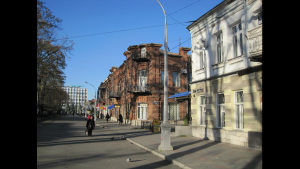
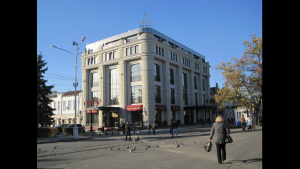
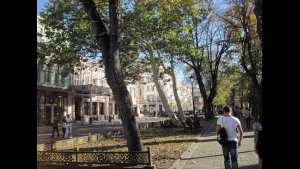
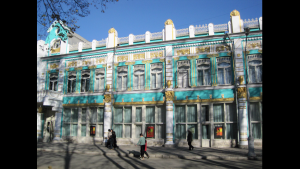
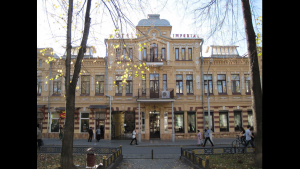
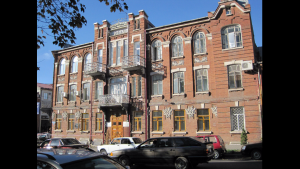
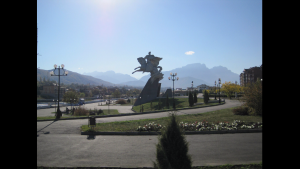
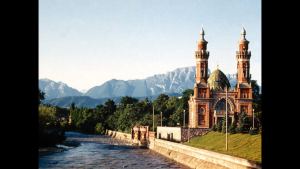
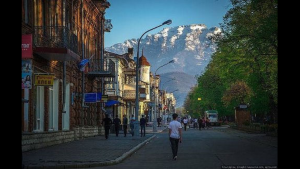
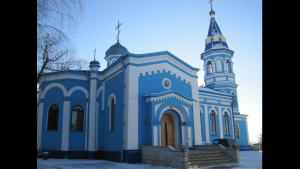
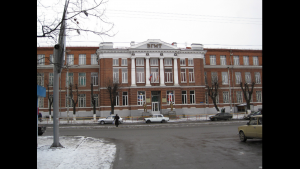
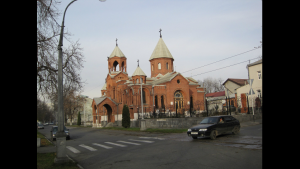
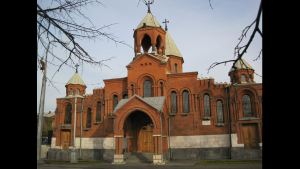
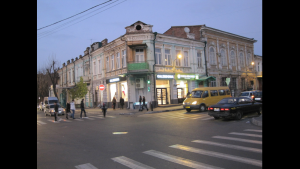
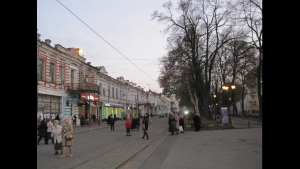
Мой город- ВЛАДИКАВКАЗ! My city – Vladikavkaz!
Monday, September 22nd, 2014The city was founded in 1784[7] as a fortress during the Russian conquest of the Caucasus and was for many years the main Russian military base in the region.
The Georgian Military Highway, crossing the mountains, was constructed in 1799 to link the city with Georgia to the south, and in 1875 a railway was built to connect it to Rostov-on-Don andBaku in Azerbaijan. Vladikavkaz has become an important industrial center for the region, with smelting, refining, chem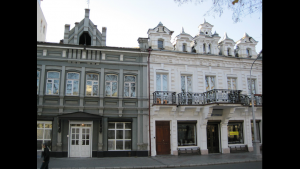 icals and manufacturing industries.
From 1931 to 1944 and from 1954 to 1990, its name in both Russian and Ossetic languages was Ordzhonikidze (Орджоники́дзе) (afterSergo Ordzhonikidze, a Georgian Bolshevik), and from 1944 to 1954 it was officially called Dzaudzhikau (Дзауджика́у) in Russian andDzæwdžyqæw (Дзæуджыхъæу) in Ossetic. Vladikavkaz resumed its old Russian name, in 1990, shortly before the dissolution of the Soviet Union; the official Ossetic name was reverted to Dzæwdžyqæw.
Vladikavkaz was fought over in both the Russian Civil War and World War II. In February 1919, the anti-Communist Volunteer Army under General Anton Denikin seized the city, before being expelled by the Red Army in March 1920. In November 1942, the forces of Nazi Germany tried unsuccessfully to seize the city but were repelled.
In 1999, 2008, and 2010, Vladikavkaz was a target of bombings.
Ethnic groups in the city (2002 data):[citation needed]
| Climate data for Vladikavkaz | |||||||||||||
|---|---|---|---|---|---|---|---|---|---|---|---|---|---|
| Month | Jan | Feb | Mar | Apr | May | Jun | Jul | Aug | Sep | Oct | Nov | Dec | Year |
| Record high °C (°F) | 19.6 (67.3) |
23.0 (73.4) |
30.3 (86.5) |
34.0 (93.2) |
35.0 (95) |
38.0 (100.4) |
37.5 (99.5) |
39.2 (102.6) |
38.2 (100.8) |
33.5 (92.3) |
27.0 (80.6) |
27.1 (80.8) |
39.2 (102.6) |
| Average high °C (°F) | 3.0 (37.4) |
3.2 (37.8) |
7.7 (45.9) |
14.8 (58.6) |
19.4 (66.9) |
23.2 (73.8) |
25.7 (78.3) |
25.4 (77.7) |
20.8 (69.4) |
15.1 (59.2) |
8.4 (47.1) |
4.3 (39.7) |
14.3 (57.7) |
| Daily mean °C (°F) | −1.9 (28.6) |
−1.7 (28.9) |
3.0 (37.4) |
9.5 (49.1) |
14.1 (57.4) |
18.0 (64.4) |
20.6 (69.1) |
20.1 (68.2) |
15.6 (60.1) |
9.8 (49.6) |
3.6 (38.5) |
−0.7 (30.7) |
9.2 (48.6) |
| Average low °C (°F) | −5.6 (21.9) |
−5.7 (21.7) |
−0.9 (30.4) |
5.1 (41.2) |
9.6 (49.3) |
13.5 (56.3) |
16.1 (61) |
15.7 (60.3) |
11.2 (52.2) |
5.7 (42.3) |
0.1 (32.2) |
−4.2 (24.4) |
5.1 (41.2) |
| Record low °C (°F) | −27.2 (−17) |
−27.8 (−18) |
−22.0 (−7.6) |
−8.9 (16) |
−2.8 (27) |
2.2 (36) |
7.5 (45.5) |
6.0 (42.8) |
0.0 (32) |
−10.0 (14) |
−22.2 (−8) |
−25.0 (−13) |
−27.8 (−18) |
| Precipitation mm (inches) | 31 (1.22) |
34 (1.34) |
54 (2.13) |
85 (3.35) |
140 (5.51) |
175 (6.89) |
109 (4.29) |
89 (3.5) |
75 (2.95) |
60 (2.36) |
46 (1.81) |
31 (1.22) |
929 (36.57) |
| Avg. precipitation days | 6 | 6 | 8 | 10 | 14 | 14 | |||||||
Edmonton’s slower market activity matches national trend
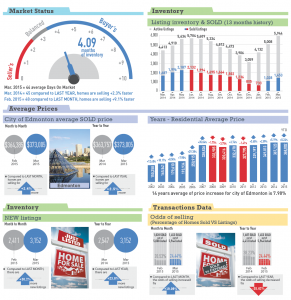
Thursday, September 6th, 2012Edmonton, September 5, 2012: Residential property sales in August slowed both month-to-month and year-to-year, mirroring a trend that has evolved nationally all summer. Sales of all types of residential properties in August (1,430) were down 17.4% from July and down 10.7% from a year ago. The number of people offering their properties for sale also slowed but not as sharply as sales. There were 2,732 residential properties listed on the Multiple Listing Service® in August; down 2.2% from a month ago and down just 5.6% from a year ago. The available inventory was reduced 2.9% to 7,458 properties.
“Housing sales across Canada have dropped slightly since May,” said REALTORS® Association of Edmonton President Doug Singleton. “The sales activity varies from market to market and it appears, when compared to last year that Edmonton is slowing faster than the national trend after a very active spring. Never-the-less, housing prices are still up from a year ago and consumer confidence is high.”
Despite the slowdown in sales, prices were up as compared to August 2011. The average* selling price of a single family detached home (SFD) was down marginally (-0.15%) at $384,477 from last month but up 3.8% from a year ago. Condo prices were also down marginally (-0.9%) from last month at $237,042 but up from last year. The all residential average price was $334,395 (down 0.5% m/m) which is up 3.2% from August 2011.
Average prices are affected by the difference in price of similar properties as well as the market composition or mix of homes sold. Compared to a year ago, a typical bungalow in August sold for 2.2% more while a typical 2-story home sold for about 3.2% more. While the price of an individual home was rising, the market composition was also changing. In August 2012, 53% of SFDs sold were priced below $375,000 as compared to 59% in 2011. In addition, the number of sales of homes over $500,000 was up from 11% in 2011 to almost 15% this year.
“August sales illustrate the changes in the composition of the market,” said Singleton. “More consumers are purchasing homes at the higher end of the market. This is an indicator of consumer confidence and a long term view that this market is stable. ”
The average days-on-market in August was up two at 54 days. The sales-to-listing ratio was down, moving down from 62.0% in July to 52.3%.

