
Posts Tagged ‘эдмонтон’
о чем надо подумать при покупке дома?
Tuesday, November 18th, 2014
о чем надо подумать при покупке дома
Fall Maintains Summer Heat in Edmonton Market
Thursday, October 2nd, 2014
Reports of the impending burst of the so called “housing bubble” have homeowners looking closer at housing prices this month. While it makes for an exciting story, the numbers just don’t back up the claim. Edmonton Census Metropolitan Area (CMA) continues to see the stable market we have enjoyed over the past few years.
The steady gain year-over-year in housing prices is reflective of a stable and strong market. Average prices, listings, and sales are all up from September of last year. The average days on market for residential properties remained the same as August at 49 (down from 54 days the same time last year). While inventory is still down 6% from September 2013.
The average price for a single family dwelling (SFD) in Edmonton in September stayed strong at $435,584 (down a mere 0.04% from August). Condos were down 3% month over month at an average selling price of $254,494. Duplex/row house prices were up 0.3% to $350,983 and the total residential average price was up 0.8% from August at $372,673.
In September, 2,193 residential properties were listed and 1,568 were reported sold (1,693 adjusted). Single family dwelling reported sales were up 4.7% from last month at 967 (1,044 adjusted) while condos were down 3.6% at 452 (488 adjusted).
We normally see a decrease in sales and average price when fall arrives. The strong market we saw in August continued on into September with surprisingly little to no changes in prices. There is a false idea out there that people only buy houses in the spring and summer. People buy and sell their houses when the time is right for them. Consulting with your Russian Ukrainian speaking local REALTOR – Irina Mierzewski – is the best way to see if the time is right for you.
The number of homes listed for sale in September was 8% higher than the same month last year. The sales-to-listing ratio was 72%: up from 67% last month.
| September 2014 | M/M % Change | Y/Y % Change | |
| SFD2 average3 selling price – month | $435,584 | -0.04% | 6.92% |
| SFD median4 selling price – month | $405,000 | 0.56% | 6.91% |
| Condominium average selling price | $254,494 | -2.94% | 4.85% |
| Condominium median selling price | $232,000 | 1.53% | 2.65% |
| All-residential5 average selling price | $372,673 | 0.83% | 6.37% |
| All-residential median selling price | $350,000 | 0.32% | 4.28% |
| # residential listings this month | 2,193 | -4.74% | 8.08% |
| # residential sales this month (reported) | 1,568 | -7.66% | 9.19% |
| # residential inventory at month end | 4,812 | -9.79% | -5.85% |
| # Total6 MLS® System sales this month | 2,122 | 4.17% | 6.47% |
| $ Total value MLS® System residential sales – month | $668 million | 3.24% | 13.15% |
| $ Total value MLS® System sales – month | $788 million | 4.95% | 13.67% |
| $ Total value MLS® System sales – YTD | $7.6 billion | 12.82% | 16.05% |
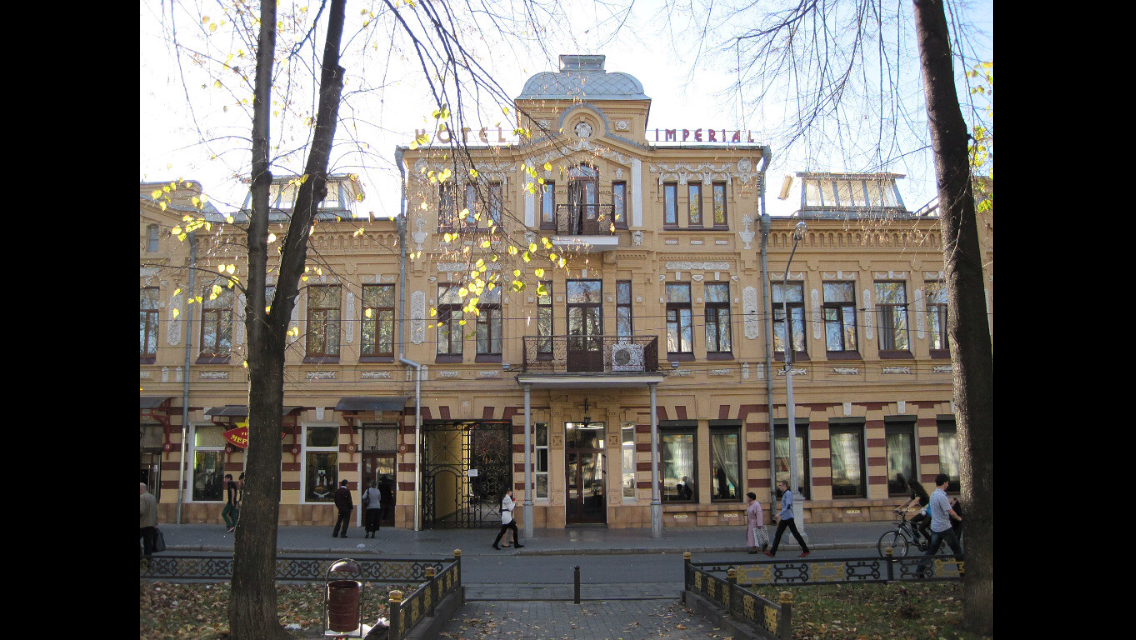
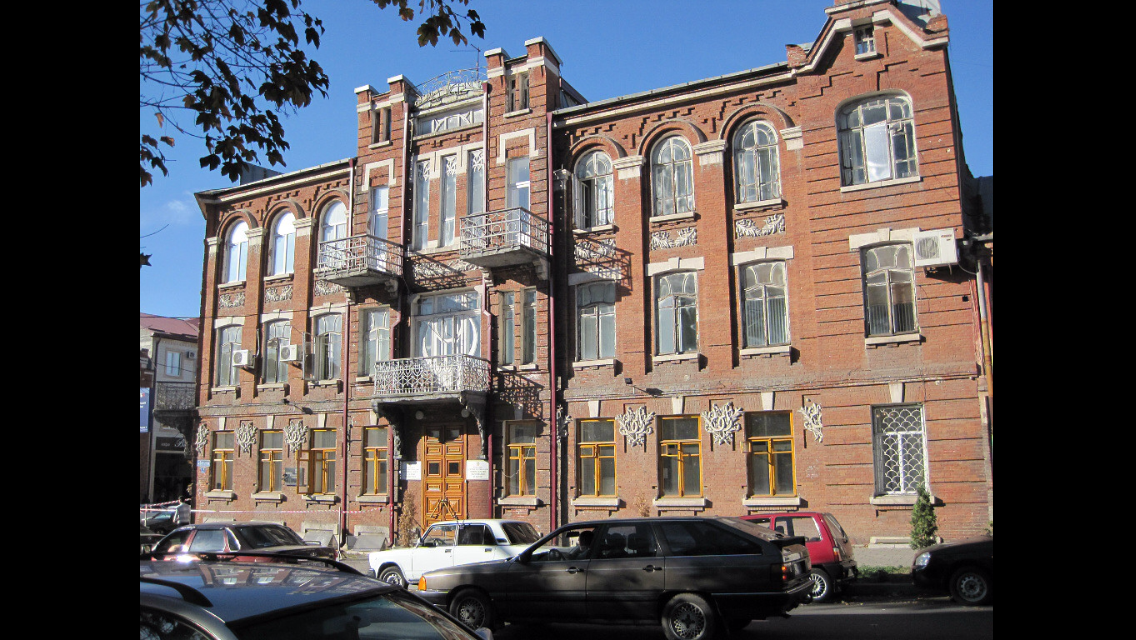
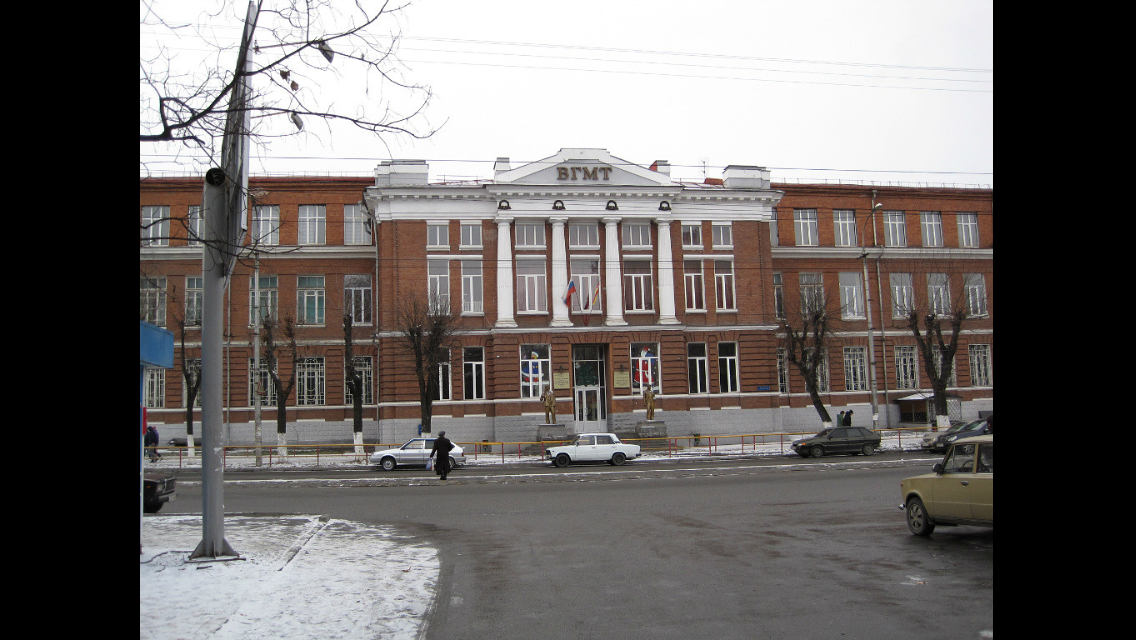
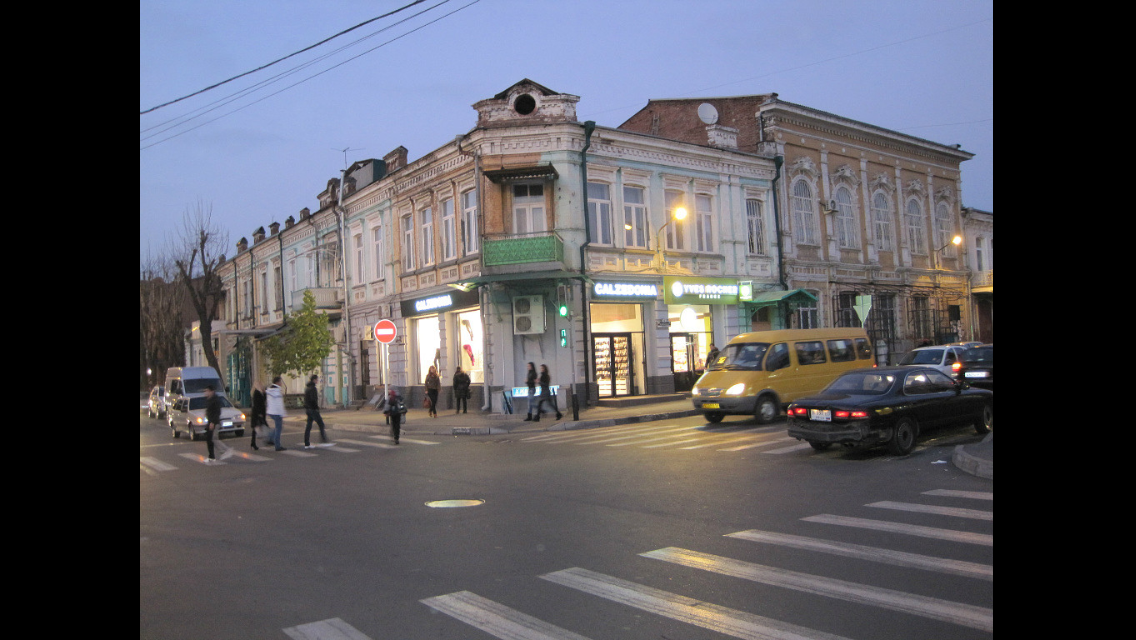
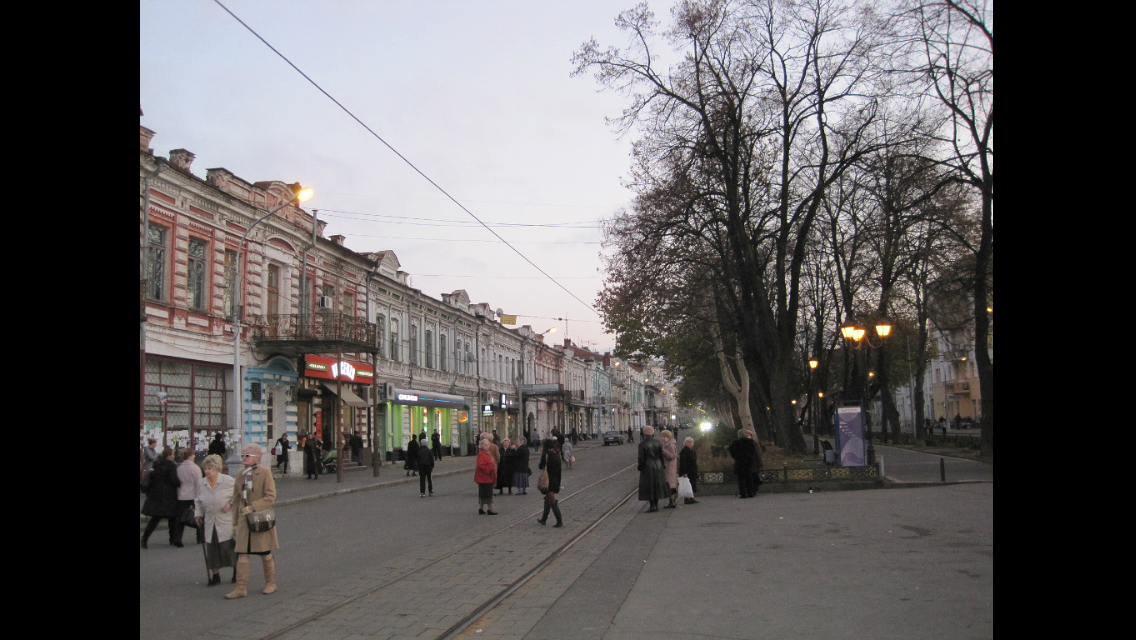
Мой город- ВЛАДИКАВКАЗ! My city – Vladikavkaz!
Monday, September 22nd, 2014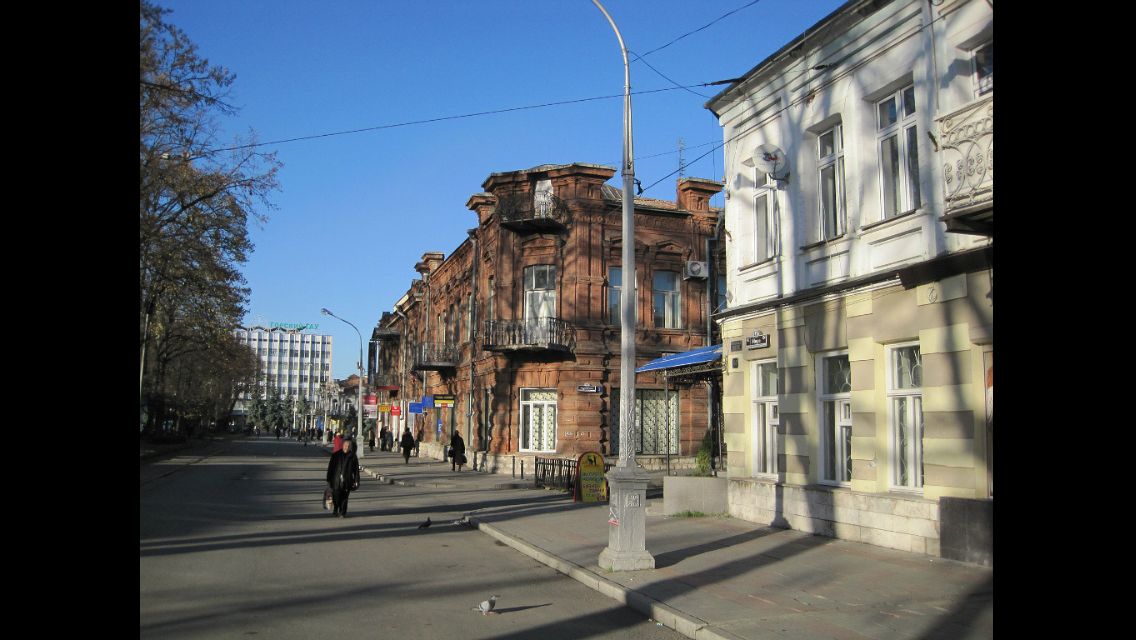
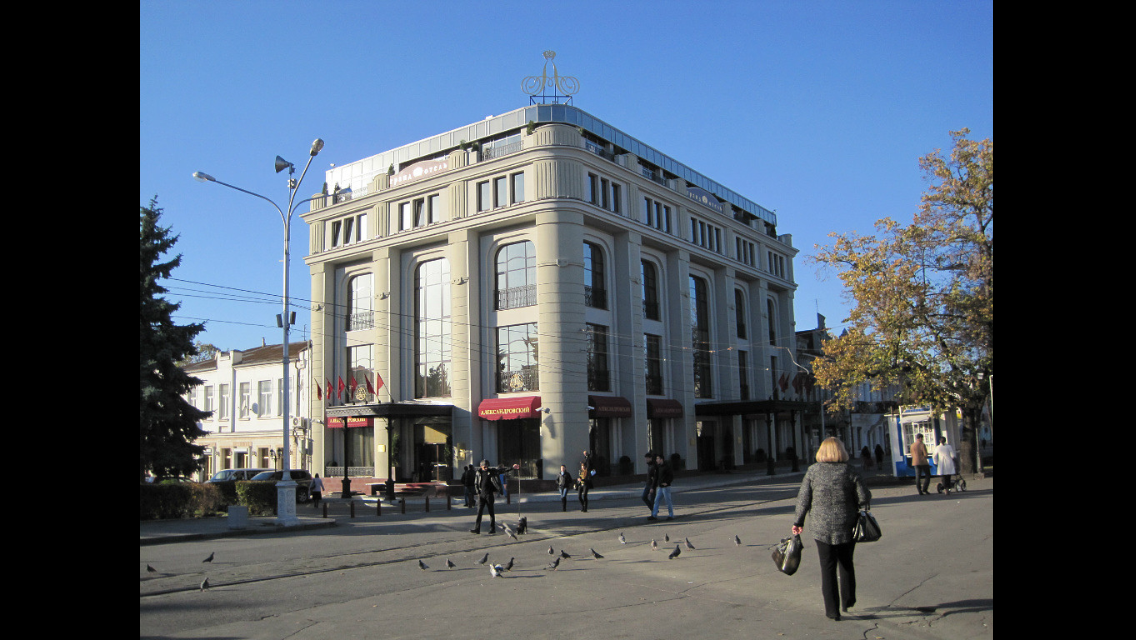
The city was founded in 1784[7] as a fortress during the Russian conquest of the Caucasus and was for many years the main Russian military base in the region.
The Georgian Military Highway, crossing the mountains, was constructed in 1799 to link the city with Georgia to the south, and in 1875 a railway was built to connect it to Rostov-on-Don andBaku in Azerbaijan. Vladikavkaz has become an important industrial center for the region, with smelting, refining, chem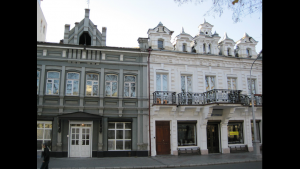 icals and manufacturing industries.


From 1931 to 1944 and from 1954 to 1990, its name in both Russian and Ossetic languages was Ordzhonikidze (Орджоники́дзе) (afterSergo Ordzhonikidze, a Georgian Bolshevik), and from 1944 to 1954 it was officially called Dzaudzhikau (Дзауджика́у) in Russian andDzæwdžyqæw (Дзæуджыхъæу) in Ossetic. Vladikavkaz resumed its old Russian name, in 1990, shortly before the dissolution of the Soviet Union; the official Ossetic name was reverted to Dzæwdžyqæw.
Vladikavkaz was fought over in both the Russian Civil War and World War II. In February 1919, the anti-Communist Volunteer Army under General Anton Denikin seized the city, before being expelled by the Red Army in March 1920. In November 1942, the forces of Nazi Germany tried unsuccessfully to seize the city but were repelled.
In 1999, 2008, and 2010, Vladikavkaz was a target of bombings.
Ethnic groups in the city (2002 data):[citation needed]
| Climate data for Vladikavkaz | |||||||||||||
|---|---|---|---|---|---|---|---|---|---|---|---|---|---|
| Month | Jan | Feb | Mar | Apr | May | Jun | Jul | Aug | Sep | Oct | Nov | Dec | Year |
| Record high °C (°F) | 19.6 (67.3) |
23.0 (73.4) |
30.3 (86.5) |
34.0 (93.2) |
35.0 (95) |
38.0 (100.4) |
37.5 (99.5) |
39.2 (102.6) |
38.2 (100.8) |
33.5 (92.3) |
27.0 (80.6) |
27.1 (80.8) |
39.2 (102.6) |
| Average high °C (°F) | 3.0 (37.4) |
3.2 (37.8) |
7.7 (45.9) |
14.8 (58.6) |
19.4 (66.9) |
23.2 (73.8) |
25.7 (78.3) |
25.4 (77.7) |
20.8 (69.4) |
15.1 (59.2) |
8.4 (47.1) |
4.3 (39.7) |
14.3 (57.7) |
| Daily mean °C (°F) | −1.9 (28.6) |
−1.7 (28.9) |
3.0 (37.4) |
9.5 (49.1) |
14.1 (57.4) |
18.0 (64.4) |
20.6 (69.1) |
20.1 (68.2) |
15.6 (60.1) |
9.8 (49.6) |
3.6 (38.5) |
−0.7 (30.7) |
9.2 (48.6) |
| Average low °C (°F) | −5.6 (21.9) |
−5.7 (21.7) |
−0.9 (30.4) |
5.1 (41.2) |
9.6 (49.3) |
13.5 (56.3) |
16.1 (61) |
15.7 (60.3) |
11.2 (52.2) |
5.7 (42.3) |
0.1 (32.2) |
−4.2 (24.4) |
5.1 (41.2) |
| Record low °C (°F) | −27.2 (−17) |
−27.8 (−18) |
−22.0 (−7.6) |
−8.9 (16) |
−2.8 (27) |
2.2 (36) |
7.5 (45.5) |
6.0 (42.8) |
0.0 (32) |
−10.0 (14) |
−22.2 (−8) |
−25.0 (−13) |
−27.8 (−18) |
| Precipitation mm (inches) | 31 (1.22) |
34 (1.34) |
54 (2.13) |
85 (3.35) |
140 (5.51) |
175 (6.89) |
109 (4.29) |
89 (3.5) |
75 (2.95) |
60 (2.36) |
46 (1.81) |
31 (1.22) |
929 (36.57) |
| Avg. precipitation days | 6 | 6 | 8 | 10 | 14 | 14 | |||||||
Housing prices begin seasonal slide, but rise over 2013
Tuesday, August 5th, 2014Edmonton, August 5, 2014:
The Single Family Detached (SFD) average price in July was down 2% from June at $426,716 and the All Residential average price was off 2.6% from June at $362,091 in the Edmonton . Condo prices were stable month-over-month at $254,654 and duplex/rowhouse average prices rallied with a 5% lift to $360,309.
Residential sales were up year-over-year from 1,835 in July 2013 to 2,013 (up 9.7%) with SFD sales (1,179) up compared to the same month last year by 4.8%.
Condo sales of 639 units were up 15.4% and duplex/row house sales were up 27.7% compared to July 2013.
There is adequate supply with over 5,600 residential properties in inventory.
The average days-on-market was up slightly to 46 days in July as compared to 41 days in June. The sales-to-listing ratio was 69%: slower than the 75% last July.
If you are looking to buy or sell your property – call Irina Mierzewski – your english ukrainian russian speaking realtor in edmonton and she will be happy to answer all your questions and assist you in all your real estate needs! please read testimonials on her page and see what other clients are saying about her and her professional real estate expertise .
| M/M % Change | Y/Y % Change | ||
| SFD2 average3 selling price – month | $426,716 | -2.00% | 3.90% |
| SFD median4 selling price – month | $396,000 | -4.00% | 3.10% |
| Condominium average selling price | $254,654 | 0.20% | 4.60% |
| Condominium median selling price | $239,000 | 0.00% | 6.20% |
| All-residential5 average selling price | $362,091 | -2.60% | 3.30% |
| All-residential median selling price | $345,000 | -3.90% | 3.00% |
| # residential listings this month | 2,718 | -8.10% | 10.60% |
| # residential sales this month (reported) | 1,864 | -12.70% | 1.60% |
| # residential inventory at month end | 5,609 | -1.70% | -3.90% |
| # Total6 MLS® System sales this month | 2,570 | -1.95% | 4.10% |
| $ Total value MLS® System residential sales – month | $786 million | -6.10% | 5.70% |
| $ Total value MLS® System sales – month | $948 million | -4.40% | 9.40% |
| $ Total value MLS® System sales – YTD | $5.9 billion | 20.90% | 16.50% |
Local housing sales and inventory up in stable market – Feb 2014
Wednesday, February 5th, 2014
The residential home inventory on the Edmonton Multiple Listing Service® (MLS® System) rose 16% in January. Typically just over 1,800 homes in the Edmonton come onto the market in January. Last month’s listings of 1,842 were higher than the 783 listed in December. Sales figures were higher than a typical January and higher than sales in December and January 2013. The increased inventory kept prices stable in all housing categories.
Compared to December, the all-residential average3 price of $347,847 was down just $1,226 or
-0.16%. Single family detached (SFD) home prices were down 1.5% at $416,344. Condominiums were priced on average3 at $230,463 (down 1.5%) and duplex/rowhouses showed the biggest movement and were down 5.3% at $336,220.
Price stability and more property available for sale results in a balanced market.Right now both buyers and sellers have time to consider all their options and housing needs. More homes are listed every day and Irina Mierzewski your russian speaking REALTOR® can advise you of a suitable property as soon as it comes available.
The residential sales-to-listing ratio was 45% and the average days-on-market was 61 days in January compared to 73 days in January 2013. There have been four property sales over a $1 million already this year but half of the SFDs sold in January were sold at or below $385,000.
Strong economic indicators such as low unemployment, higher hourly wages and positive in-migration all support an optimistic view of the Edmonton and area housing market. Consumers are confident in their economic future and prepared to risk a first-time or move-up purchase. Low rental vacancies and the potential for higher rental rates are also attracting investors into the market.
Irina Mierzewski – your russian/ukranian speaking REALTOR in Edmonton will be happy to answer all your questions and give her professional advise whether you sell or buy property in the near future.
| January 2014 | M/M % Change | Y/Y % Change | |
| SFD2 average3 selling price – month | $416,344 | -1.50% | 4.60% |
| SFD median4 selling price – month | $385,000 | 0.20% | 2.70% |
| Condominium average selling price | $230,463 | -1.50% | 6.70% |
| Condominium median selling price | $216,500 | -1.10% | 3.80% |
| All-residential5 average selling price | $347,847 | -0.20% | 6.70% |
| All-residential median selling price | $329,500 | 0.45% | 4.60% |
| # residential listings this month | 1,842 | 135.20% | 4.20% |
| # residential sales this month (reported) | 820 | 10.00% | -1.00% |
| # residential inventory at month end | 3,537 | 16.00% | -5.50% |
| # Total6 MLS® System sales this month | 1,095 | 14.70% | -11.90% |
| $ Total value MLS® System residential sales – month | $328 million | 12.90% | -6.50% |
| $ Total value MLS® System sales – month | $392 million | 11.20% | -3.80% |
| $ Total value MLS® System sales – YTD | $392 million | 11.20% | -3.80% |
REALTORS® forecast local housing growth in steady market Jan 2014
Wednesday, January 8th, 2014Forecast for 2014: value of MLS® sales in 2014 will increase by about 3% for the year after sales of $8 billion in 2013. This is based on an overall increase in the number of homes sold and increased prices.
The sale of single family homes in Edmonton will be static, at about 10,500. The number of sales of condo, duplex and rowhouse sales will increase by 2.5% throughout the region as these properties become the de facto entry point for first time buyers.
Prices, as usual, will fluctuate through the year but the 12-month average price for a single family detached property is anticipated to increase about 3%. Condominium property average prices are projected to increase about 2% over the year.
Market growth is always good for the seller who can expect to see a capital gain on their property. But it is also reassuring for the buyer who can expect steady growth upon entering the market.
| YTD Average | Change | At year end | |
| SFD Prices (CMA) | $409,824 | Up 3% | $422,000 |
| Condo prices (CMA) | $241,377 | Up 2% | $246,000 |
| All Residential Prices | $349,202 | Up 2.5% | $357,932 |
| Rural/Recreational | $548 million | Sustaining | $550 million |
| Commercial sales | $225 million | Stronger | $250 million |
| Total MLS® Sales | 22,932 | Up 2% | 23,390 |
| Value of Total MLS® Sales | $8 billion | Increase | $8.6 billion |
September Housing prices up 5.4% from last year!
Saturday, October 5th, 2013The all-residential average price for the first three quarters of the year in the Edmonton CMA is $350,741 as compared to $340,090 in 2012. In September, the all-residential average was $352,057, up 5.4% from a year ago and inching up from $351,455 in the previous month.
Year-over-year sales were also up 19.4% with 1,466 (adjusted, 1,357 actual) all-residential sales in September. There were 13,691 residential sales in the Edmonton CMA in the first three quarters of 2013 as compared to just 12,876 sales at the same time last year.
The market is very active with many properties attracting multiple offers.The increases in the Alberta population are driving the market and because of the steady sales there are inventory shortages at the lower price ranges.
There were 926 (adjusted, actual 857) single-family detached sales in September at an average price of $408,642 (up 3.9% Y/Y) as compared to 773 sales a year ago at an average price of $393,374. Condos sold on average in September for $243,655 (438 adjusted sales, 406 actual), up from $224,330 last September (up 8.6%). Duplex/row house sales were up with 79 (adjusted ,73 actual) sales, valued on average at $338,250 ($316,973 last year).
Average sales prices are the highest they have been in five years,Combined with the highest sales numbers since 2012, we have year-to-date residential sales values totaling $4.8 million. Strong market fundamentals, increasing population and the persistence of low mortgage rates have convinced many buyers that an investment in real estate is secure.
The September sales-to-listing ratio of 65% was the result of 2,089 residential listings and 1,357 residential sales. The inventory of available homes on the Edmonton MLS® System was down from 5,557 units in August to 5,111 units in September. It took 54 days on average (up one) to sell a home in the Edmonton area. Irina Mierzewski has access to all the latest market data and effective marketing tools and is the best source of real estate advice for both buyers and sellers.
MLS® System Activity (for all-residential sales in Edmonton CMA1)
| September 2013 | M/M % Change | Y/Y % Change | |
| SFD2 average3 selling price – month | $408,642 | -1.90% | 3.90% |
| SFD median4 selling price – month | $380,000 | 0.00% | 3.50% |
| Condominium average selling price | $243,655 | -0.40% | 8.60% |
| Condominium median selling price | $226,000 | -1.70% | 3.80% |
| All-residential5 average selling price | $352,057 | 0.20% | 5.40% |
| All-residential median selling price | $336,000 | 1.80% | 5.30% |
| # residential listings this month | 2,089 | -9.10% | 1.70% |
| # residential sales this month (actual) | 1,357 | -8.90% | 10.50% |
| # residential inventory at month end | 5,111 | -8.00% | -9.80% |
| # Total6 MLS® System sales this month | 1,882 | -5.60% | 9.42% |
| $ Value Total residential sales this month | $562 million | -6.50% | 14.83% |
| $ Value of total MLS® System sales – month | $657 million | -7.80% | 14.30% |
| $ Value of total MLS® System sales – YTD | $6.463 billion | 11.90% | 7.71% |
1 Census Metropolitan Area (Edmonton and municipalities in the four surrounding counties)
2 Single Family Dwelling
3 Average: The total value of sales in a category divided by the number of properties sold
4 Median: The middle figure in an ordered list of all sales prices
5 Residential includes SFD, condos and duplex/row houses
6 Includes residential, rural and commercial sales
3 Average prices indicate market trends only. They do not reflect actual changes for a particular property, which may vary from house to house and area to area. Prior period sales figures have been adjusted to include late reported sales and cancellations and therefore reflect a more accurate view of the period than previously reported at month end. The RAE trading area includes communities beyond the CMA (Census Metropolitan Area) and therefore average and median prices may include sold properties outside the CMA. For information on a specific area, contact Irina Mierzewski – your local REALTOR®
Title Insurance
Wednesday, April 17th, 2013
This is the article written by author Stan Galbraith of Galbraith Law.
Within the last 10 years, a new insurance product has arrived in Alberta. It is commonly referred to as title insurance.
What is title insurance? This product was never available before so what has changed? What does title insurance provide that cannot more adequately be provided by a Real Property Report (RPR)?
Title insurance has been a popular product throughout the United States for many years. In fact, Chicago Title traces its history back before the famous Chicago fire caused by the cow. The three major title insurance companies providing insurance in Alberta all have a parent company in the USA. These companies first started Canadian operations in Ontario.
Both the USA and eastern Canada operate a different Land Titles registration and transfer system then we have here in Alberta. We are fortunate in Alberta to have a government-guaranteed Land Titles system commonly referred to as the TORRENS system. Throughout the rest of North America, when you get a Title, you can never be completely sure that it discloses everything. For example, there could be an unregistered mortgage or unregistered transfer that may impair your title. In Alberta, “what you see is what you get” and the government guarantees this.
Previously, title insurance primarily covered the issues covered by the Torrens system. Eventually, companies became innovative and expanded their coverage, so their insurance had applicability here in Alberta. Over the years they have continually added new items to their coverage. Now, their product offers substantial benefits at a very reasonable one-time cost. Some of the issues title insurance covers is as follows.
It covers the gap between submission and registration. A couple of years ago when registration was taking 5 weeks or more, you could never be sure when you submitted your documents as to other registrations in the stream that may affect your title. For example, I acted for one purchaser where the sellers ex-spouse filed a Matrimonial Property Judgment against the title one week before we submitted our Transfer of Land. When we submitted, the Judgment was not there. By the time we got registration, the Judgment was registered. Title insurance will step in to deal with this.
It will cover deficiencies that would not show on a Real Property Report such as unregistered utility easements or builders liens or matters that would be shown by non-Land Titles searches such as deficient corporate status. It will cover hidden deficiencies such as underground storage tanks or underground septic tanks. In one case, they paid out a claim to move a septic tank when it turned out the tank was buried partly under the neighbors land. Coverage is also provided for unknown special assessments on condominiums.
Title insurance covers issues that would have been shown on a Real Property Report if one had been obtained. Use of this product can avoid the need to obtain a Real Property Report. It also covers internal non-compliance issues that would never be shown on a Real Property Report such as lack of building permits or failure to meet building code on renovations such as a basement development.
Even where there are known defects, title insurance will often underwrite these issues. This could include a fence in the wrong location or a deck that is too big for the property.
Most of this coverage continues after the closing date. Perhaps the most important coverage that continues after the closing date and during the entire time the property is owned is against forgery, fraud, duress, incompetency, incapacity, or impersonation.
Title insurance is an insurance product. As such, it does not fix a problem. It provides insurance or indemnity coverage. In other words, the title insurer has no obligation to do anything until a problem actually arises. When this happens, they have the choice to pay damages rather than actually fix the problem. Problems can be deferred or masked instead of fixed.
Deferring or masking problems can come back to haunt all parties at a later date. For example, when a seller, who accepted title insurance when they bought, sells and the buyer does not accept title insurance they may be forced to solve the problem. Obtaining Encroachment Agreements, especially where fences or other structures encroach onto municipal land can be quite costly. Likewise, applying for and obtaining development and building permits can be time consuming and expensive. If a buyer insists on this solution, the seller may be forced to undertake an expensive remedy and may look to the realtor and lawyer who helped them originally purchase the property for some redress. Accordingly, it is doubly important to ensure a purchaser understands the extent and impact of title insurance coverage and the fact that it does not apply when they sell the property. By simply insisting that any new buyer obtain title insurance rather than relying on an RPR, they will continue to defer any issues.
Overall, in my view, title insurance is a valuable addition to the real estate marketplace in Alberta. The coverage for future fraud for the entire ownership of the property by payment of a one-time premium is enough justification to purchase title insurance on every real estate purchase. In some cases, title insurance is the only way to effectively close a real estate deal.
About the author: Stan Galbraith is a lawyer with over 25 years of experience. He was admitted to the Alberta Bar in 1983 and has operated his own law office since 1988. Stan has a wealth of experience ranging from litigation and appeal work, to teaching and writing. He has now left the world of litigation behind and works with commercial and residential Realtors and their clients on closing their transactions. He also practices extensively in the areas of small business and wills and estate planning and administration. You can find his website at www.galbraith.ab.ca.
Housing prices and sales up in active, but balanced market
Wednesday, April 3rd, 2013The REALTORS® Association of Edmonton reports that residential property prices in the Edmonton CMA1 were up again in March. The all-residential price (includes single family detached, condominiums, duplexes and row-houses) rose 3.5% in a month and single family detached prices were up 3.9%. Compared to March 2012, the all residential price was up 4.3% and the SFD price was up 7.0%.
Because of a shortage of lower priced homes, the average price is pushed up as buyers move up-market to find a home. The increase in average price may not increase the market value of a particular property. The relative number of homes sold in the $450-650k price range increased from 12.2% to 14.5% year-over-year while homes under $300,000 dropped from 40.7% of the market to 38.2%.
The average price for a single family detached home was $416,739 in March, condos were priced at $246,574 (up 6.3% m/m), duplex and rowhouses at $316,110 (down 4.9% m/m) and the all-residential average price was $354,759. SFD prices peaked in May of 2007 at $424,400.
The demand for homes in the Edmonton area continues to be driven by net job creation and low unemployment, economic stability and low rental vacancy rates. Sales were brisk with the sales-to-listing ratio up at 57% for March which indicates that almost six of the ten homes listed during the month were sold. Days-on-market was down from 57 in February to 50 in March.
The number of homes available for sale in the MLS® System inventory was up from 4,183 to 4,741 in March. While this is an increase of 558 properties from last month, it is down 15.4% from the same time last year. The lower inventory is exerting upward pressure on prices but has a dampening effect on sales. “When first time buyers cannot find a house that meets their needs or are forced into a multiple offer situation, they often remain on the sidelines. Low interest rates and rising rental rates create the interest and desire but lack of suitable properties means they are not able to make the transition to home ownership at this time.
REALTORS® are facing some multiple offer situations on lower-priced property but overall, the market remains in balance with neither buyers nor sellers having an advantage in most neighbourhoods.
Residential sales in the Edmonton CMA were up 1.14% in March as compared to March 2012. There were 1,497 estimated sales (1,386 reported) on listings of 2,422 during the month. SFD sales were down 6.63% from last year but condo sales more than compensated at 8.84% y/y increase. Note that sales numbers are estimated to reflect late reported sales and make a more accurate comparison with prior month actual sales.
MLS® System Activity (for all-residential sales in Edmonton CMA1)
| March 2013 | M/M % Change | Y/Y % Change | |
| SFD2 average3 selling price – month | 416,739 | 3.93% | 7.03% |
| SFD median4 selling price – month | 380,000 | 1.20% | 4.40% |
| Condominium average selling price | 246,574 | 6.34% | 7.53% |
| Condominium median selling price | 229,500 | 8.03% | 4.32% |
| All-residential5 average selling price | 354,759 | 3.51% | 4.30% |
| All-residential median selling price | 329,700 | 0.84% | 2.00% |
| # residential listings this month | 2,422 | 21.40% | -14.93% |
| # residential sales this month | 1,386 | 37.50% | -6.35% |
| # residential inventory at month end | 4,741 | 13.34% | -15.41% |
| # Total6 MLS® System sales this month | 1,822 | 33.58% | -8.30% |
| $ Value Total residential sales this month | $569 million | 40.02% | -2.54% |
| $ Value of total MLS® System sales – month | $644 million | 36.88% | -5.17% |
| $ Value of total MLS® System sales – YTD | $1.458 billion | 39.82% | -4.81% |
